The Inspect tools in MeshInspector provide a comprehensive set of features for analyzing geometry, validating measurements, and extracting precise geometric information from 3D models. This section is designed to support inspection, quality control, and analytical workflows. It does so allowing users to measure distances, angles, thickness, curvature, and deviations.

Surface Deviation
Surface Deviation visualizes geometric differences between two objects by computing and displaying the distance between their surfaces. The result is shown as a color-coded deviation map applied to the inspected object, making it easy to identify areas where geometry differs from a reference.
The Surface Deviation tool requires exactly two visual objects that can be compared geometrically.
Surface Deviation becomes available only in one of these valid cases:
-
Exactly two meshes.
-
Exactly two point clouds.
-
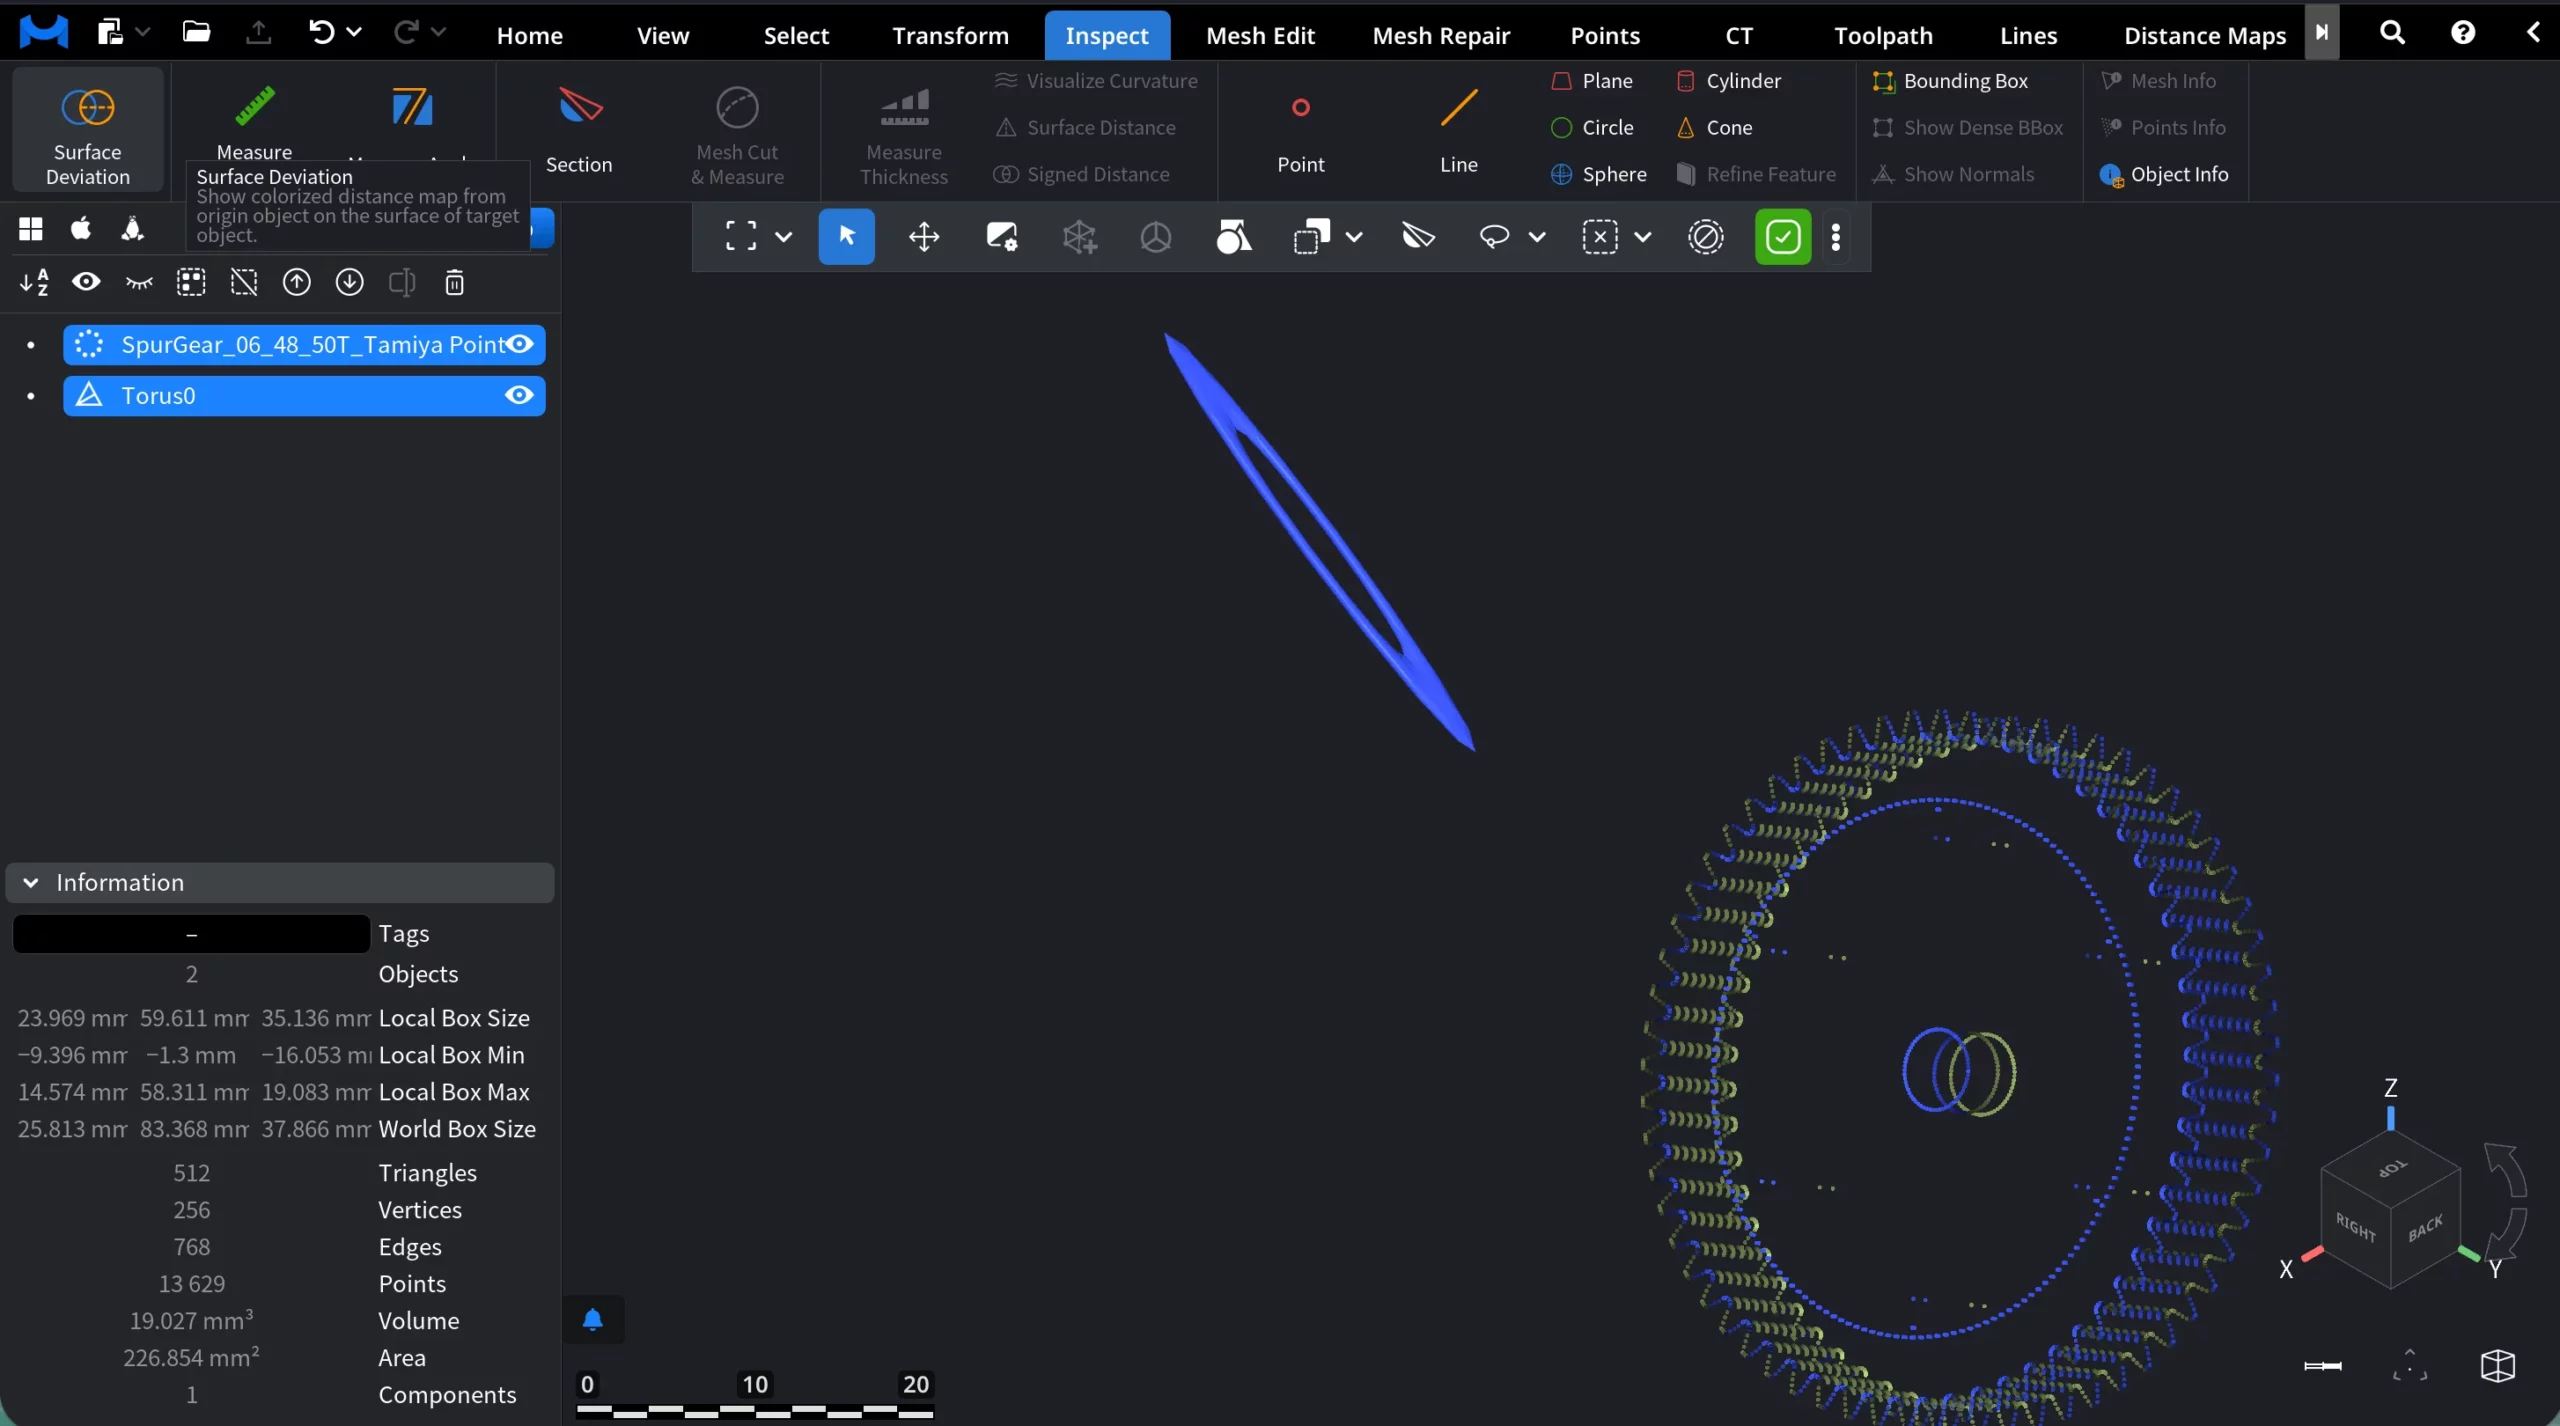
Two Visual Objects, where one is a Mesh and the other is a Point Cloud, like it is shown in the screenshot below.
Two objects before clicking Surface Deviation
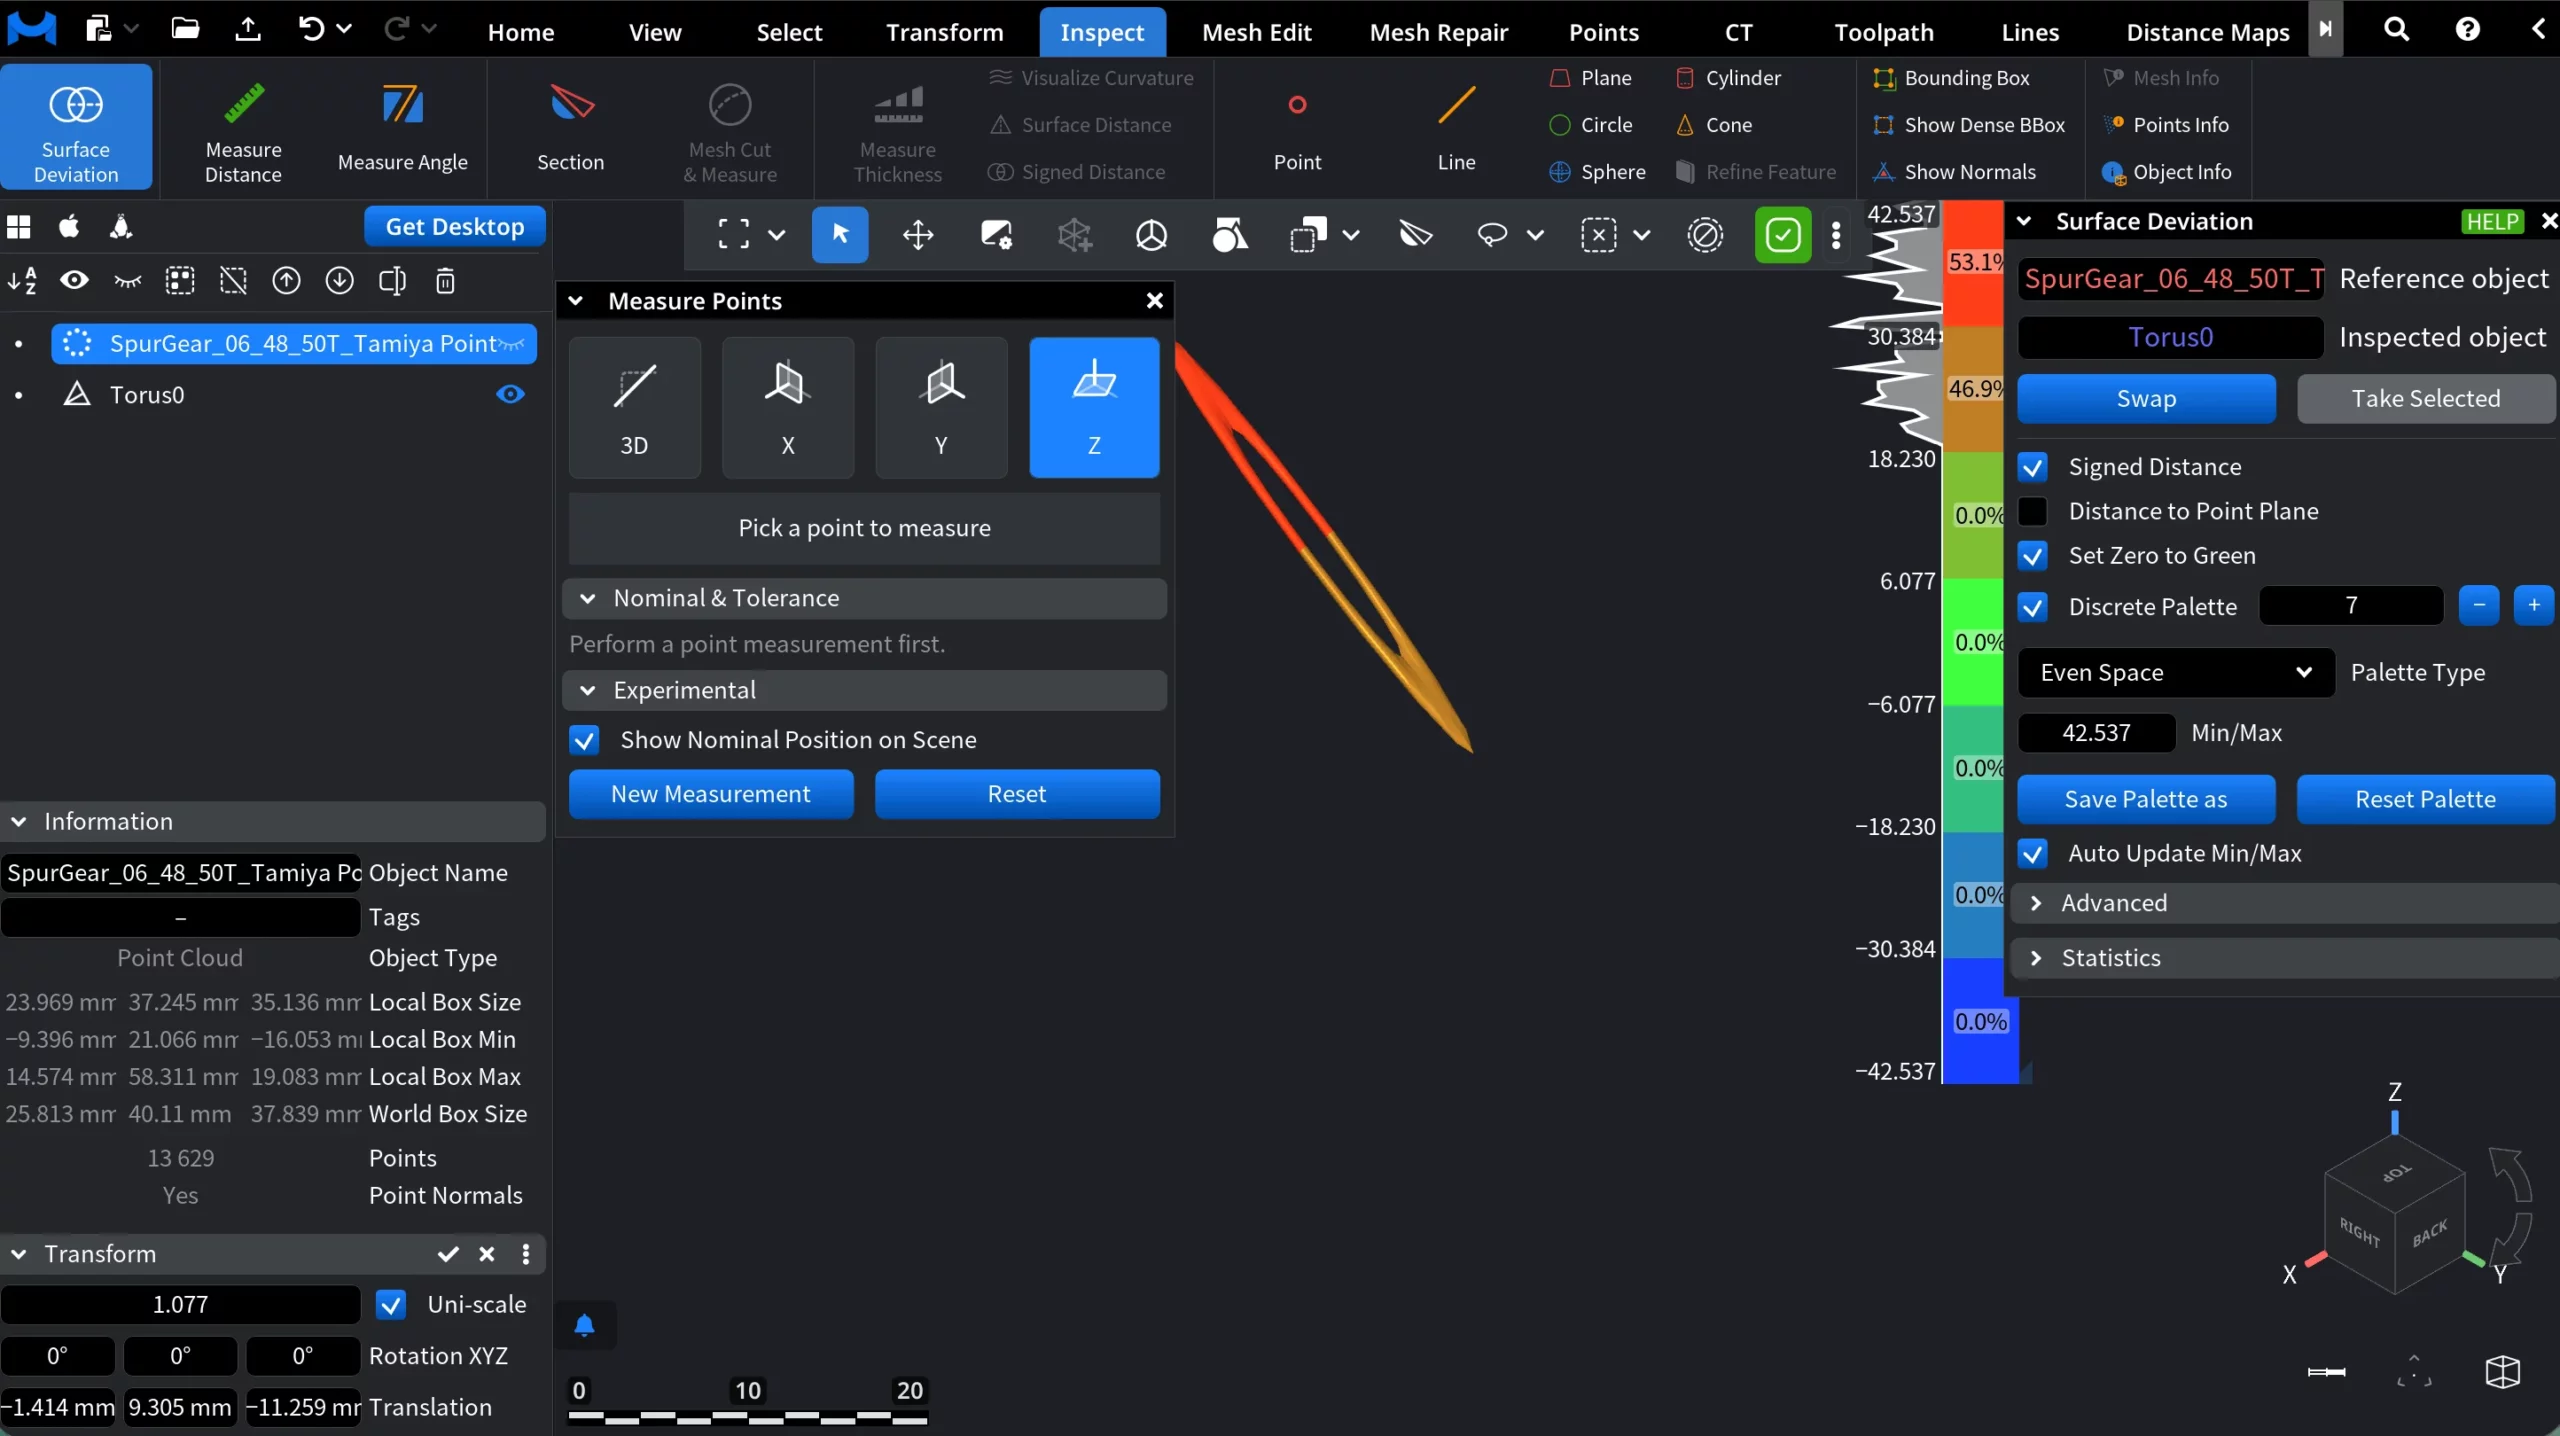
When Surface Deviation is activated (with a valid selection), MeshInspector switches the viewport into deviation inspection mode. New elements appear.
Two objects after clicking Surface Deviation
1. Deviation color map on the inspected object
The inspected object is overlaid with a false-color deviation map.
-
Colors represent the signed distance between the inspected object and the reference object.
-
Green corresponds to zero deviation.
-
Warm colors indicate positive deviation.
-
Cool colors indicate negative deviation.
This color overlay is applied directly to the object’s surface.
2. Deviation legend (vertical color ruler)
A vertical color scale appears in the viewport. This is the “ruler” you are seeing in the screenshot. It shows:
-
The full deviation range (Min / Max) in model units.
-
Discrete or continuous color bands.
-
Percentage distribution per band.
The legend provides immediate quantitative context for the colorized result.
3. Surface deviation panel
When Surface Deviation is activated, a dedicated Surface Deviation panel opens on the right side of the interface. This panel controls how deviation is computed, visualized, and interpreted.
4. Measure points panel
A floating Measure Points panel becomes available in the viewport. This panel allows you to pick specific points and measure distance between them. This tool complements the color map by enabling precise and point-level inspection.
Surface Deviation Panel: Settings and Actions
The Surface Deviation panel controls how distances between the reference and inspected objects are computed, visualized, and interpreted.
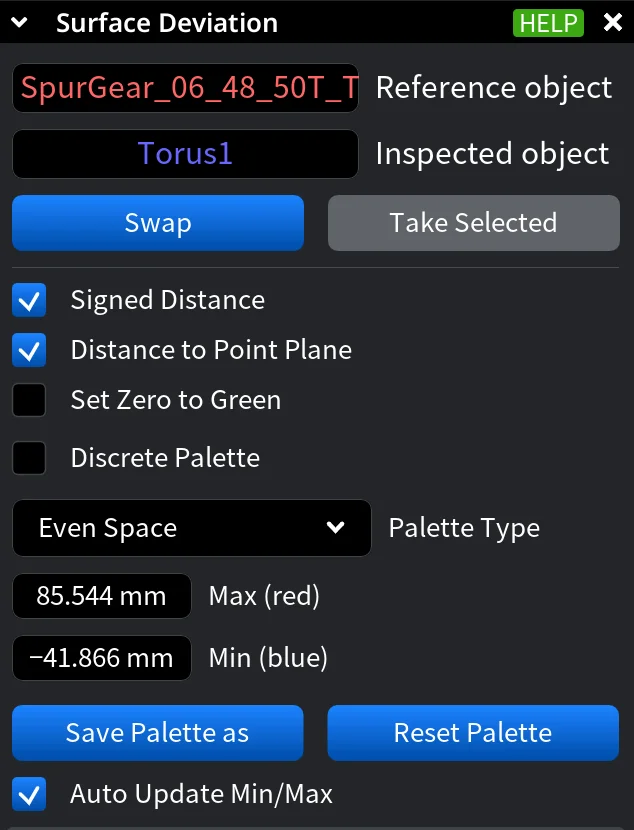
Reference and Inspected objects
- Reference object is the object used as the baseline for distance calculation. Distances are measured from this object.
- Inspected object is the object that receives the color-coded deviation map.
- Swap exchanges the reference and inspected objects.
- Take Selected replaces the current reference and inspected objects with the two objects that are currently selected in the scene.
Signed Distance. When enabled, deviation values are signed:
-
Positive values indicate the inspected object lies outside the reference object.
-
Negative values indicate the inspected object lies inside the reference object.
If disabled, all distances are treated as absolute (unsigned).
Distance to Point Plane. When enabled, distance is computed to a plane defined by the nearest point on the reference object and its normal, rather than directly to the closest surface point. This can produce less intuitive color patterns.
Set Zero to Green forces zero deviation to always be displayed as green, regardless of palette configuration.
Discrete Palette. When enabled, the continuous deviation range is split into a fixed number of discrete color bands.
-
The numeric field defines the number of discrete levels.
-
The + and - buttons increase or decrease the number of bands.
When disabled, the palette is continuous.
Palette Type defines how the deviation range is distributed across colors. Even Space means the full Min/Max range is divided evenly. Each color band represents the same numerical distance interval. As for Central Zone, it emphasizes a tolerance zone around zero deviation. As such, it allows you to define:
-
-
Max positive (red)
-
Min positive (green)
-
Max negative (green)
-
Min negative (blue)
-
The active palette type determines which numeric fields are displayed below.
Min / Max with Even Space defines the numerical limits of the color scale:
-
Max (red) is highest positive deviation
-
Min (blue) is lowest negative deviation
In Central Zone mode, these are split into four separate bounds.
Save Palette as saves the current palette configuration for reuse.
Reset Palette restores the default palette and range settings.
Auto Update Min/Max, when enabled, adjusts the palette automatically whenever the deviation data changes.
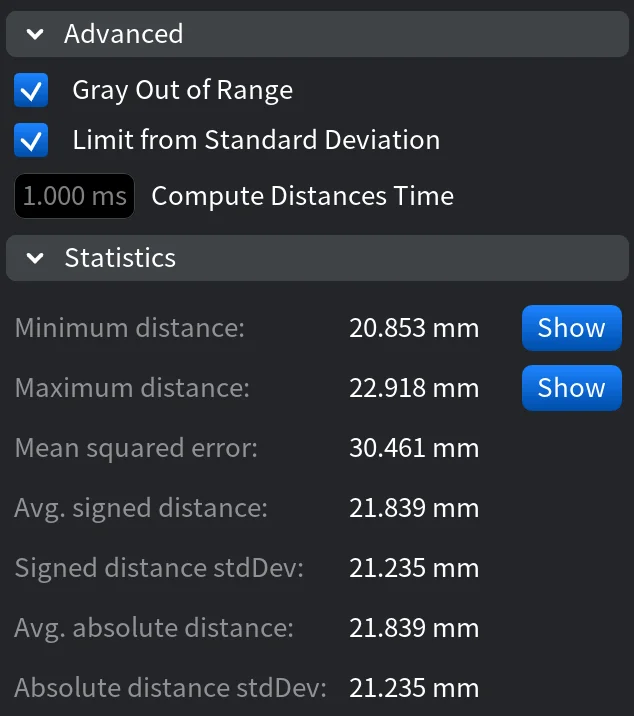
Advanced Settings
Gray Out of Range renders deviation values outside the current palette range in gray. This helps visually suppress outliers and can improve performance, especially when signed distance is enabled.
Limit from Standard Deviation controls how automatic Min/Max limits are calculated when Auto Update Min/Max is on:
-
Enabled: limits are set to signed mean ± 3× standard deviation.
-
Disabled: limits are taken directly from the absolute Min/Max values.
This option is available only when Set Zero to Green is disabled.
Compute Distances Time displays the time spent on the last deviation computation (in milliseconds). This is a read-only performance indicator.
Statistics
The Statistics section provides numerical summaries of the computed surface deviation between the reference and inspected objects.
Measure Points Panel
Measure Points is a precision tool that lets you inspect exact distances between two picked points on the inspected object, complementing the surface color map with numeric measurements. After activating Surface Deviation, the Measure Points panel appears as a floating window in the viewport.
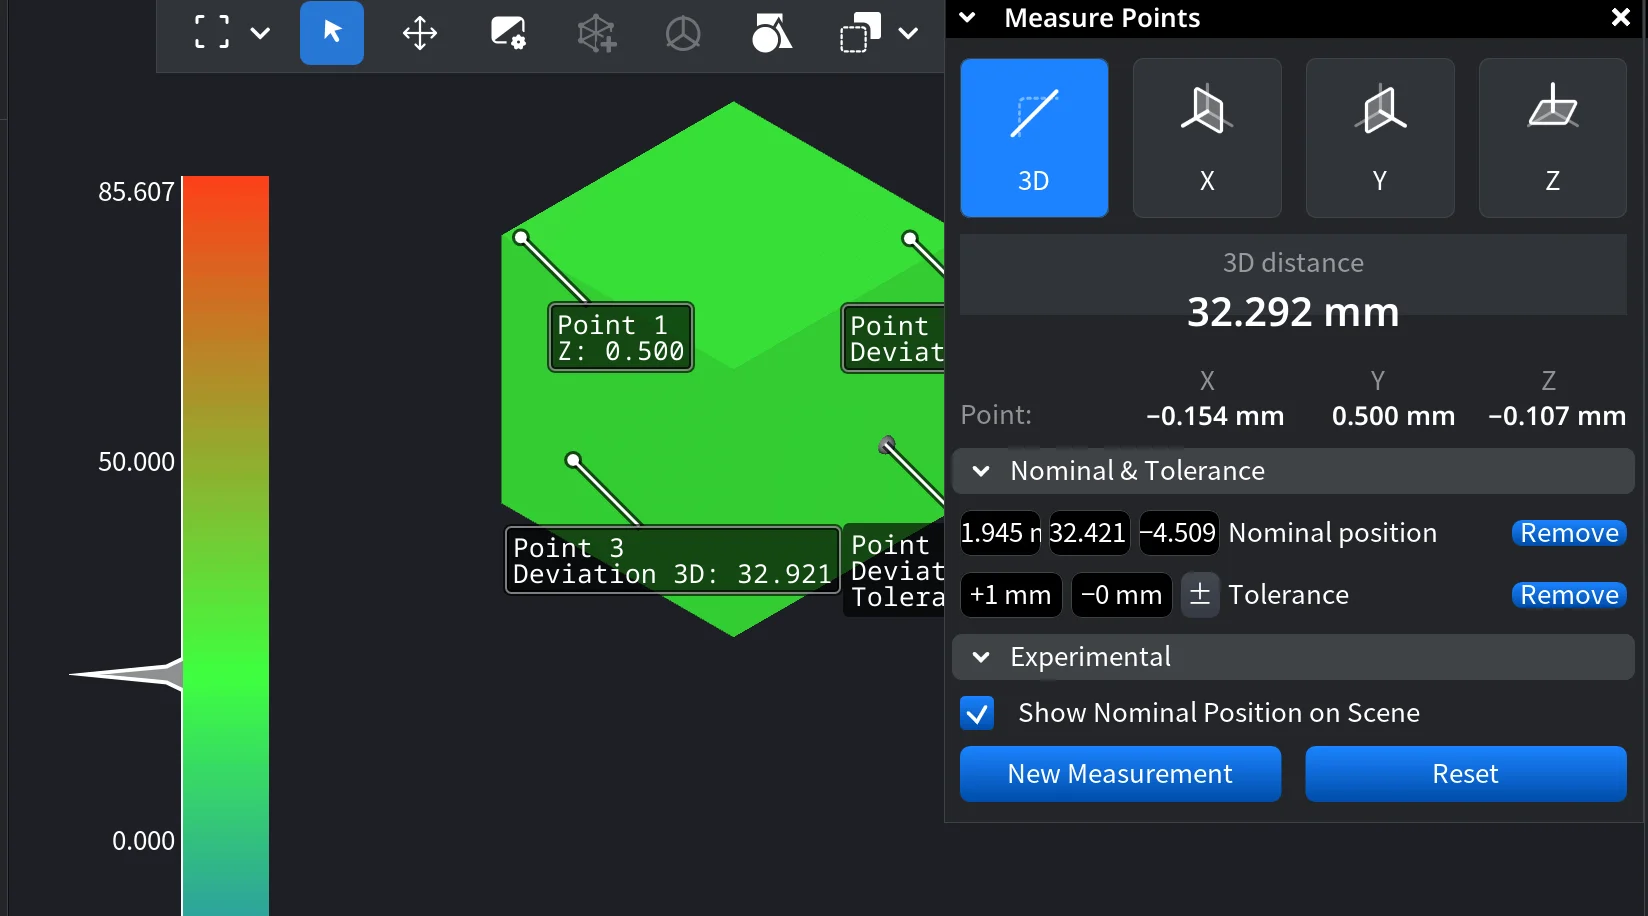
Measurement Modes
-
3D measures the true 3D distance between two points.
-
X / Y / Z measure the distance projected onto the selected axis only.
Measurement Readout
-
The main value shows the measured distance in model units.
-
In 3D mode, individual X, Y, and Z components are also displayed.
-
Labels in the viewport indicate each picked point and its deviation value.
Nominal Position and Tolerance
This section allows you to define a nominal position and an acceptable tolerance range for the measurement.
-
Nominal position stores a reference value for comparison.
-
Tolerance (±) defines allowable deviation from the nominal value.
-
When enabled, tolerance feedback is shown directly in the scene.
Experimental
-
Show Nominal Position on Scene displays the nominal reference visually in the viewport for easier comparison.
Actions
-
New Measurement starts a fresh point-picking sequence.
-
Reset clears the current measurement and removes markers.
Measure Distance
Measure Distance is a precision inspection tool that allows you to measure distances between points on geometric entities in the scene. You click on the object and obtain all the data pertaining to distance in this case.
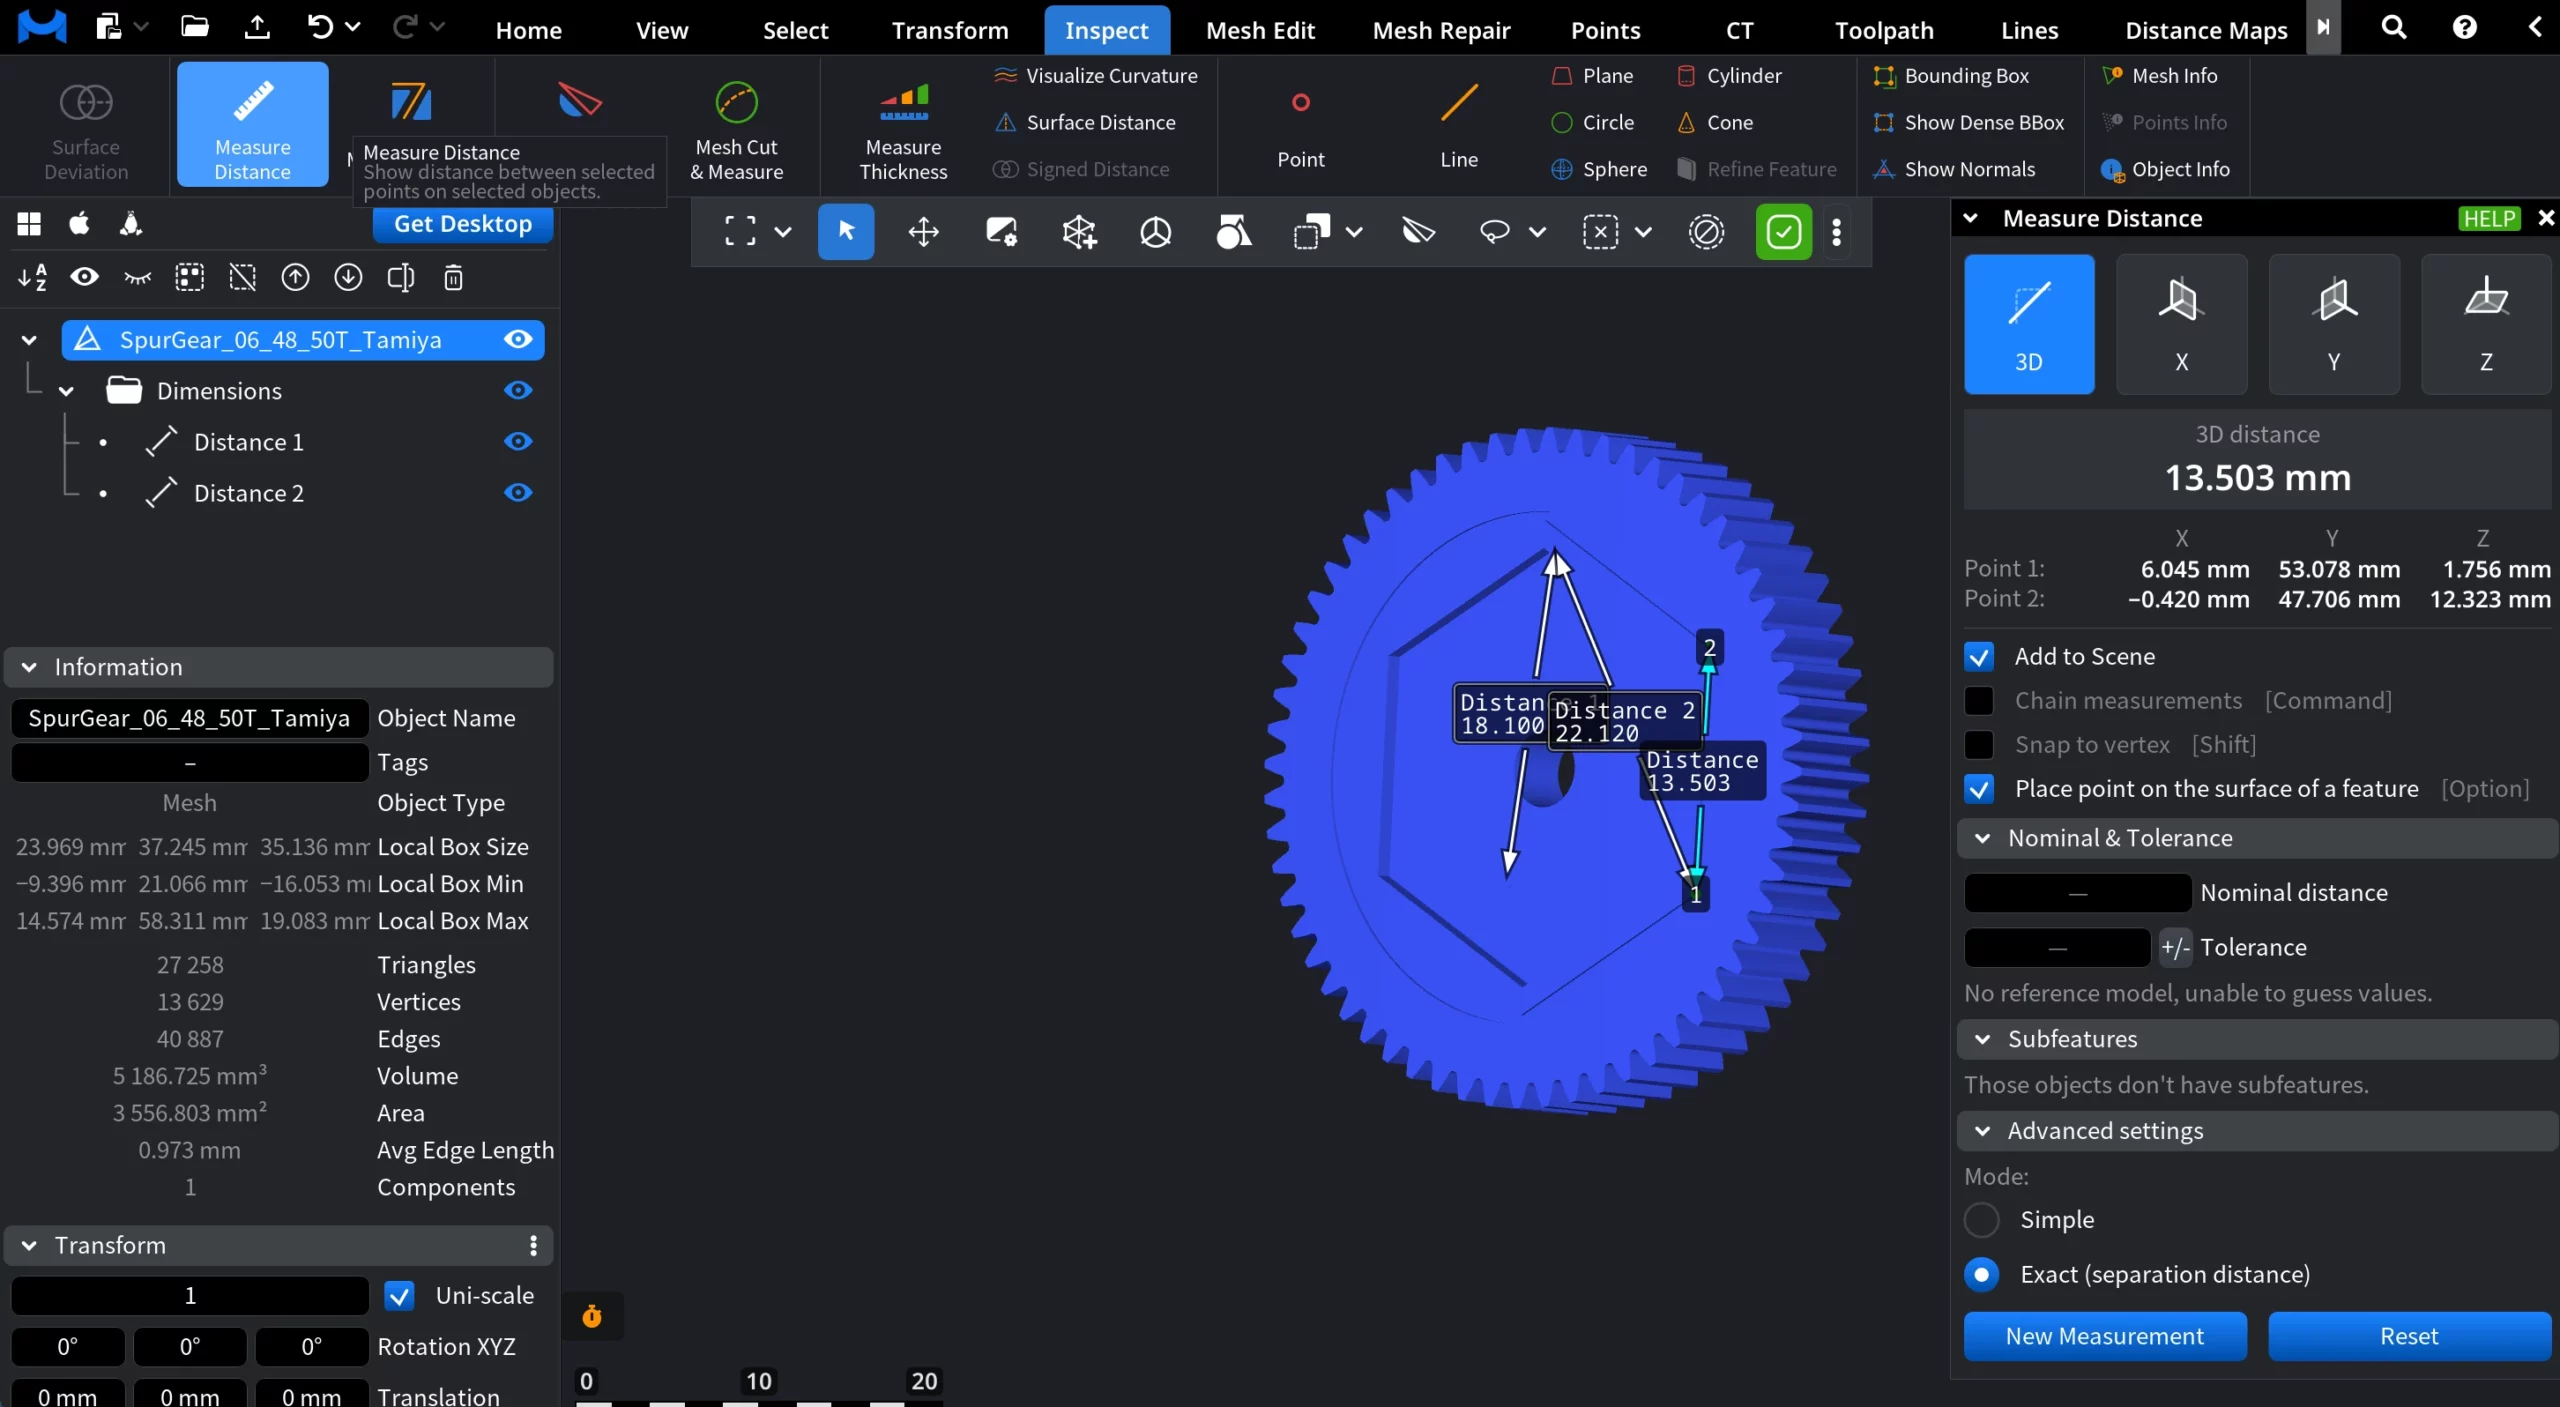
Measurement Modes
Measure Distance supports multiple measurement modes:
3D measures the true Euclidean distance between two selected points or features in 3D space.
X / Y / Z measure the distance projected onto the selected axis only.
Point Coordinates
When a distance measurement is created, the Measure Distance panel also displays the coordinates of the two picked points:
-
Point 1 stands for the coordinates of the first selected point
-
Point 2 stands for the coordinates of the second selected point
For each point, its X, Y, and Z coordinates are shown in the current model units and coordinate system.
Measurement Settings
Add to Scene controls whether measurements are kept.
-
When it is enabled, each finished measurement stays in the scene as a separate distance object.
-
When it is disabled, every new measurement replaces the previous one.
Chain measurements that you activate by clicking Command controls continuous measuring.
-
If on, each new point starts from the previous endpoint, creating a chain of distances.
-
If off, each measurement is independent and starts fresh.
Snap to vertex that you activate by clicking Shift controls point precision.
-
When on, measurement points snap exactly to mesh vertices.
-
When off, points can be placed freely on surfaces.
Place point on the surface of a feature that you activate by clicking Option controls how points attach to geometry.
Nominal and Tolerance
This section lets you compare a measured distance against a target value and an allowed deviation. It becomes active after a distance measurement is created
- Nominal distance the expected (design) value of the distance.
- ± Tolerance is the allowed deviation from the nominal value.
Subfeatures
The Subfeatures section exposes logical reference points of selected geometric features. Subfeatures appear only when you select a supported feature.
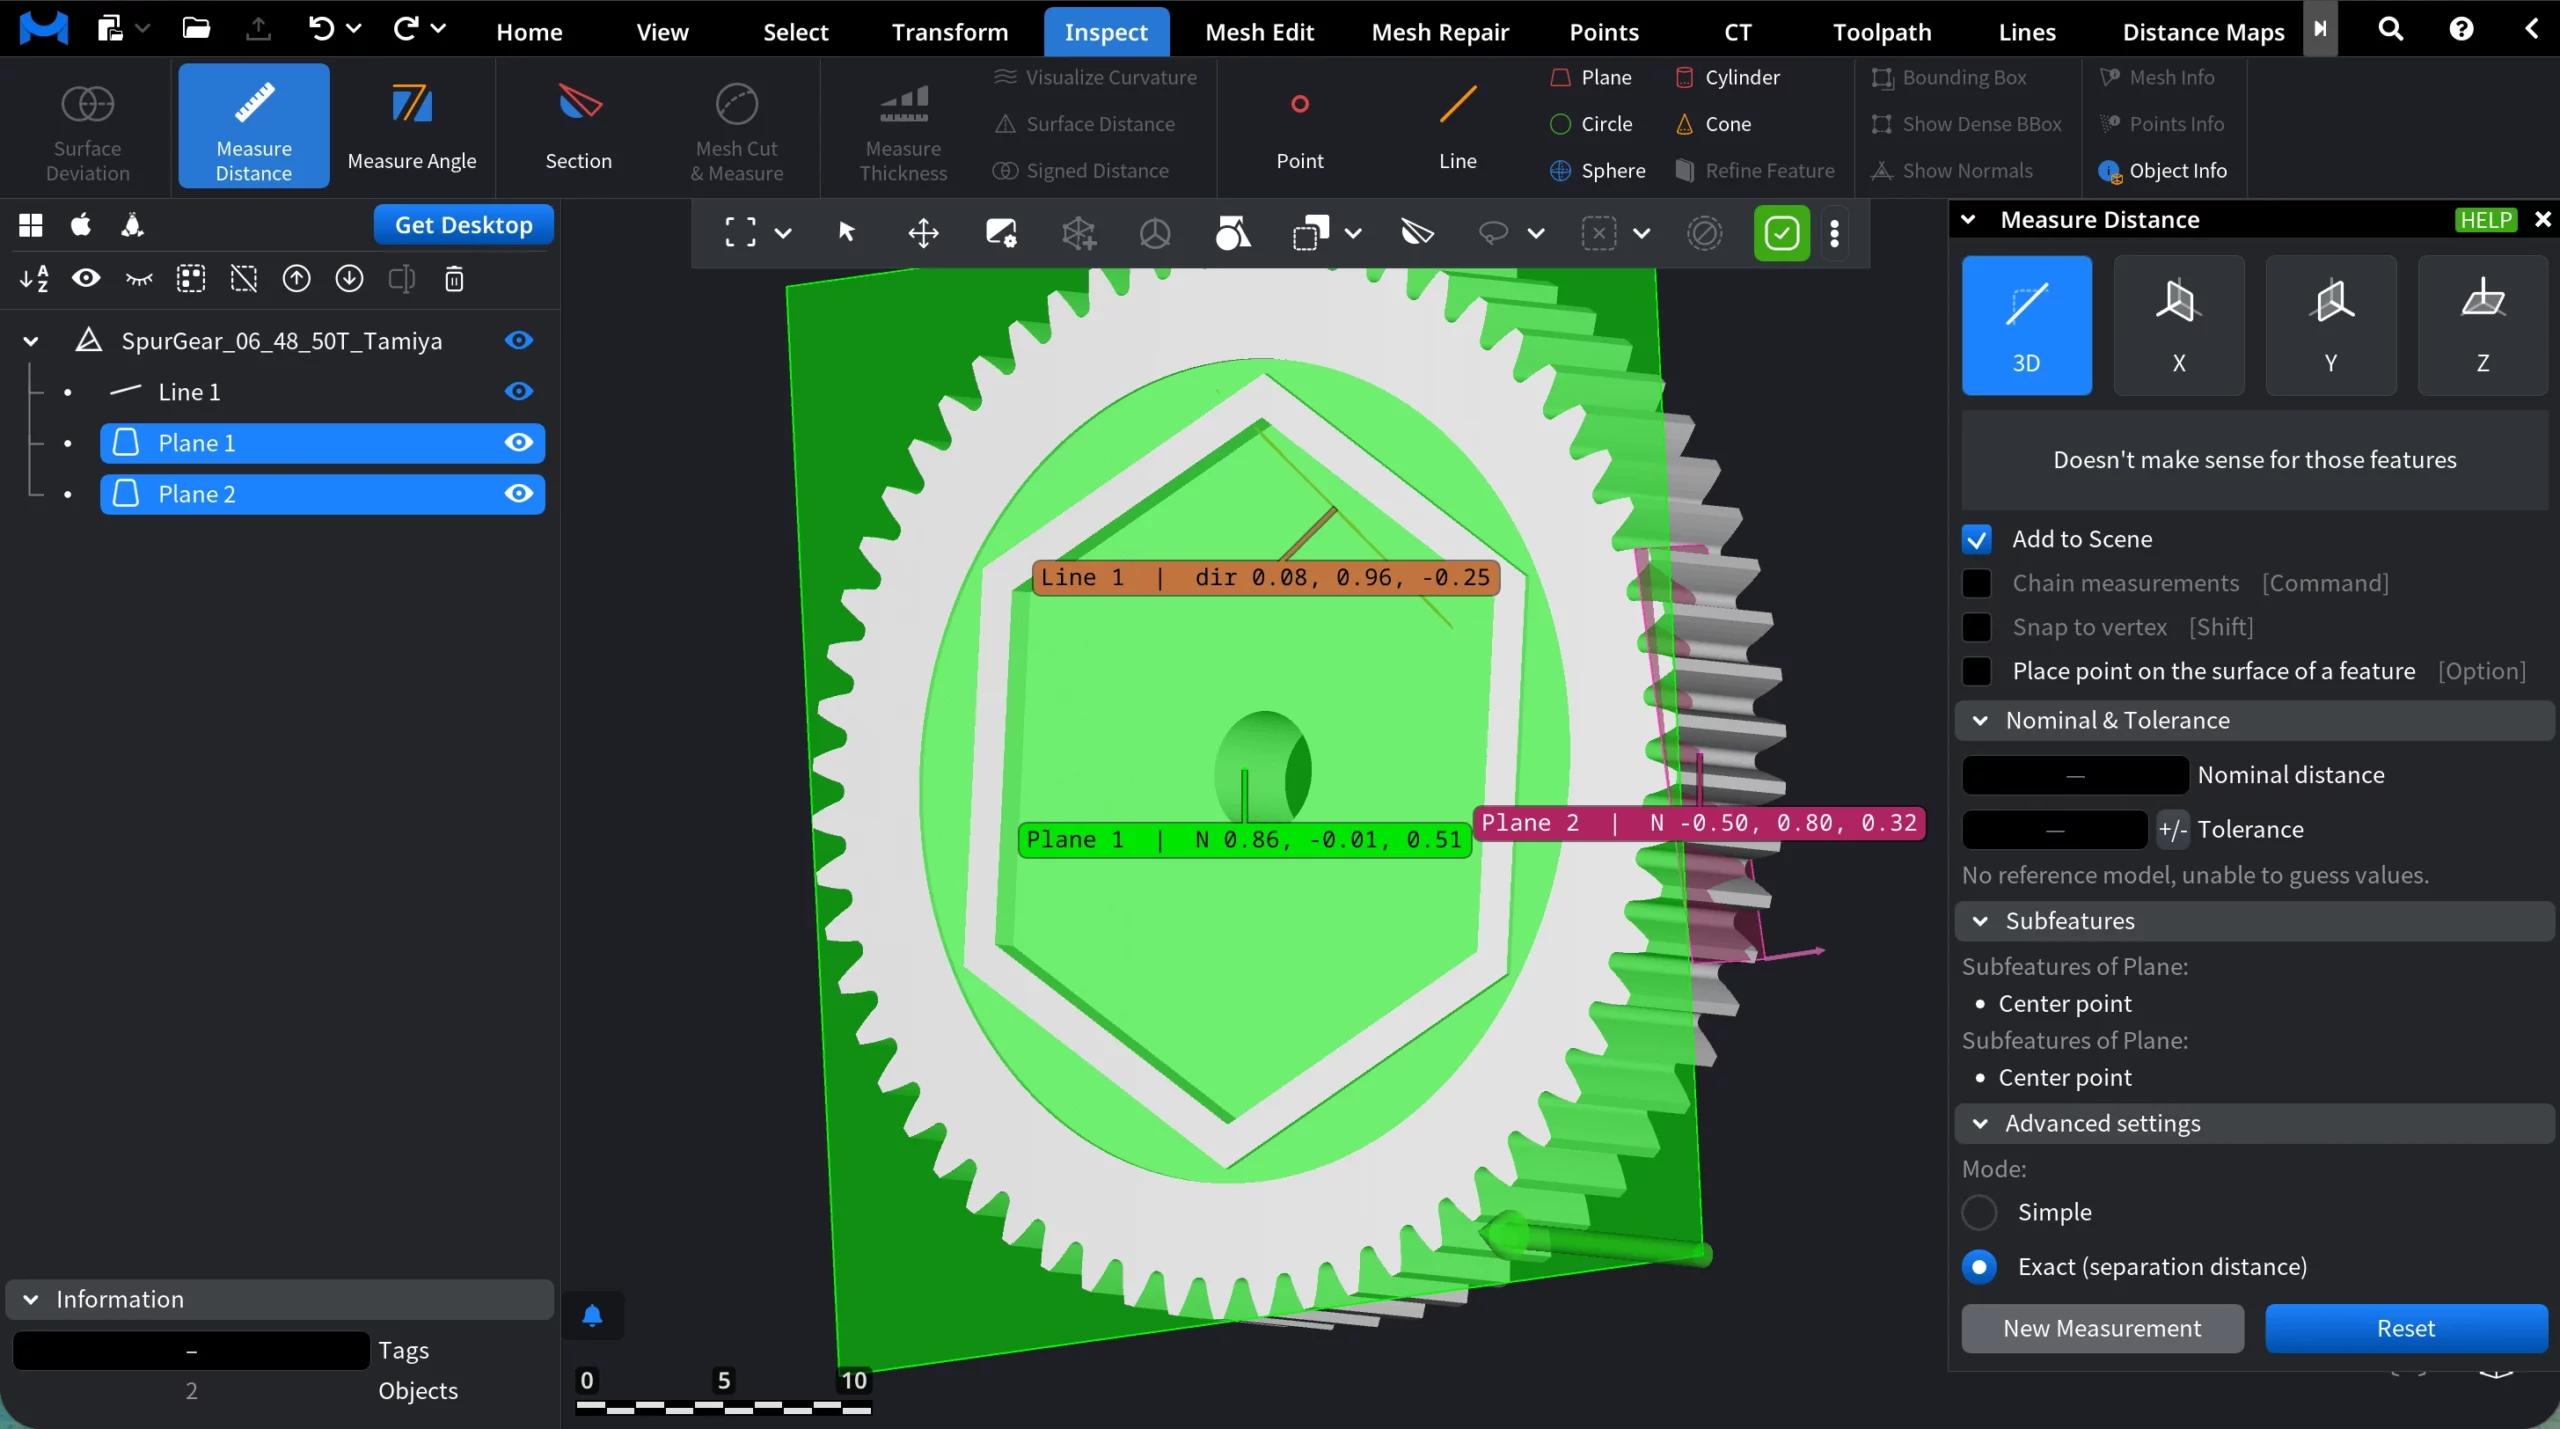
Advanced settings
Advanced settings define how the distance itself is computed and how measurements are managed.
Mode
- Simple measures the straight-line (Euclidean) distance between the selected points or features.
- Exact (separation distance) computes the true minimum separation between the selected features, taking their actual geometry into account.
Commands
New Measurement starts a new distance measurement session.
Reset clears the current measurement state.
Measure Angle
Measure Angle is an inspection tool that lets you measure edges that you select on objects of interest. When activated, Measure Angle opens a dedicated panel and enables angle construction directly in the viewport.
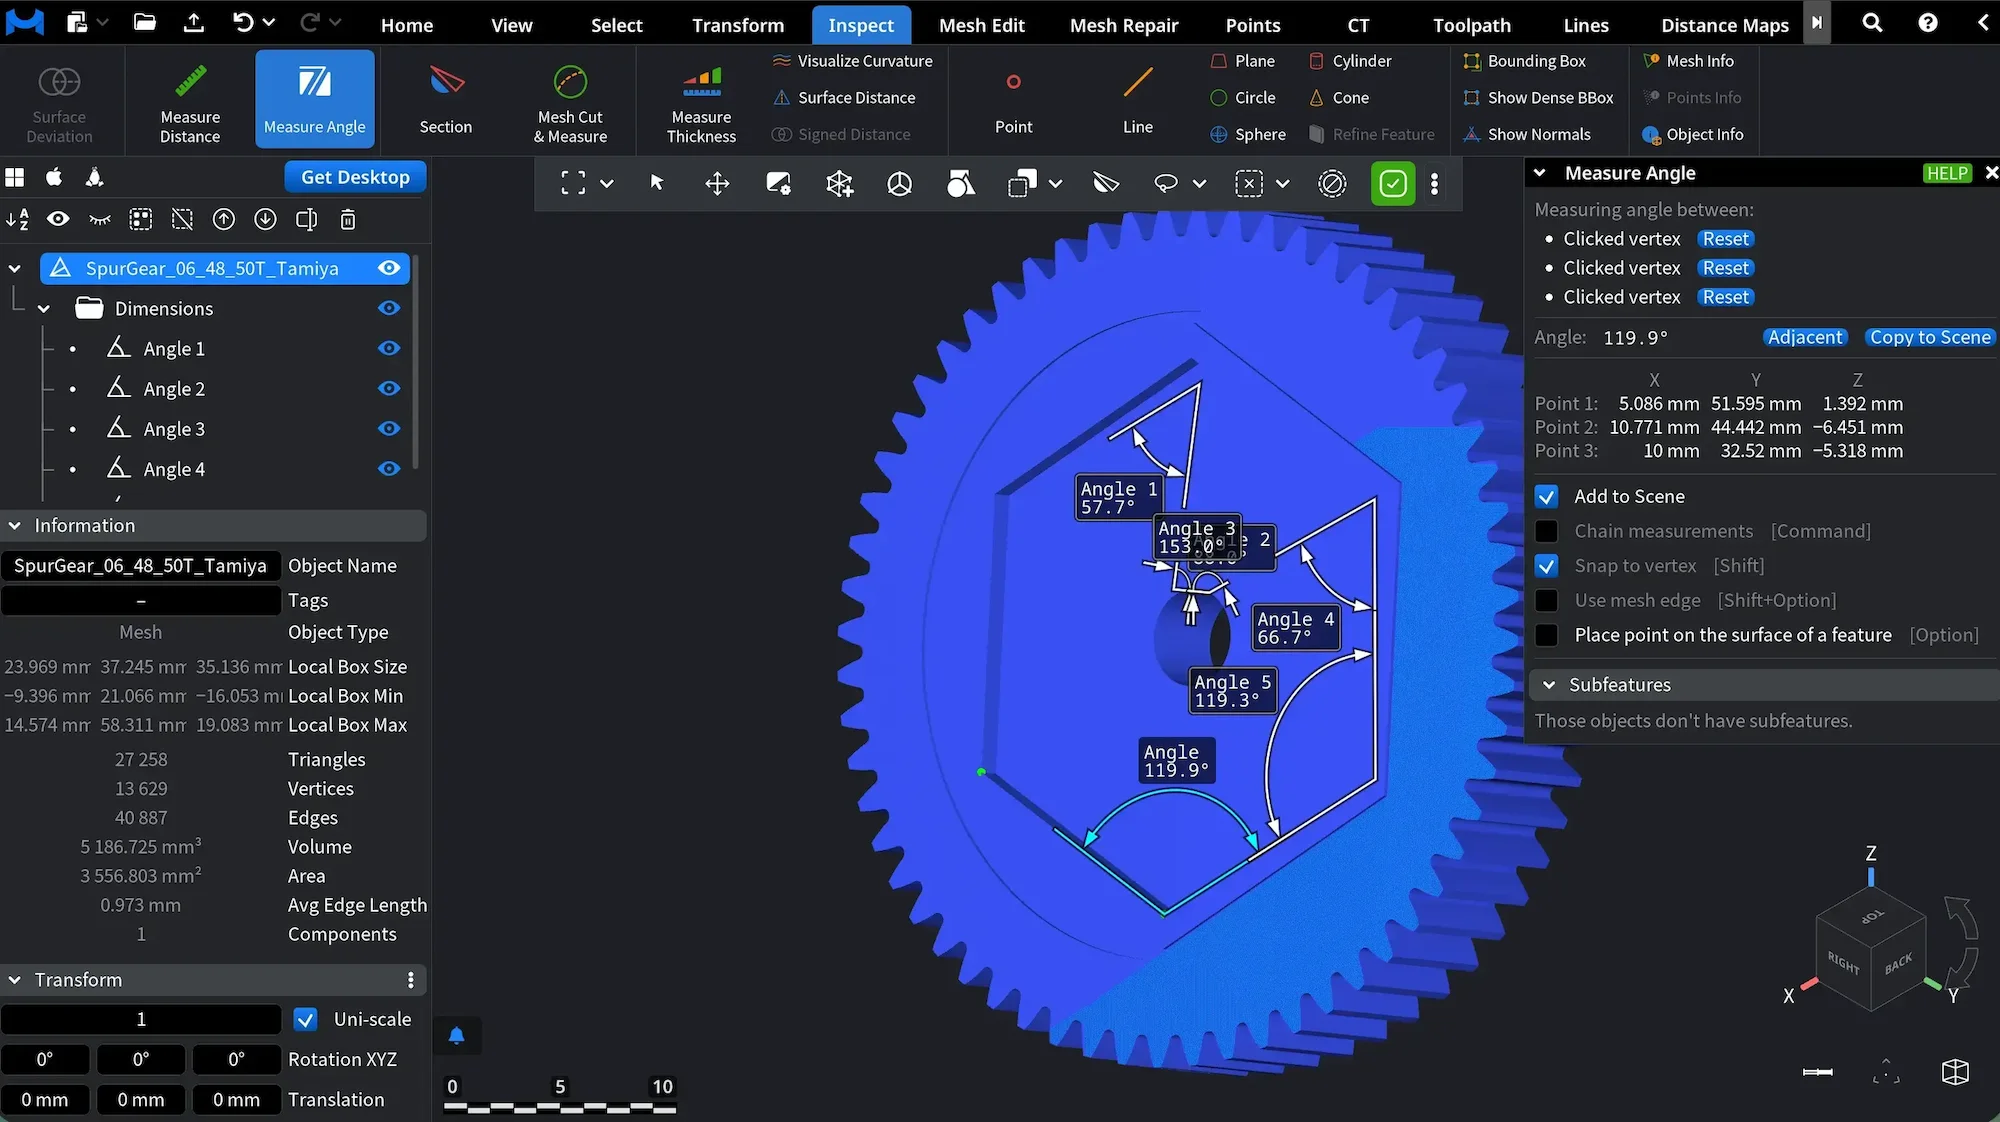
Measurement Modes and Settings
There are two main ways to use Measure Angle, depending on the active settings.
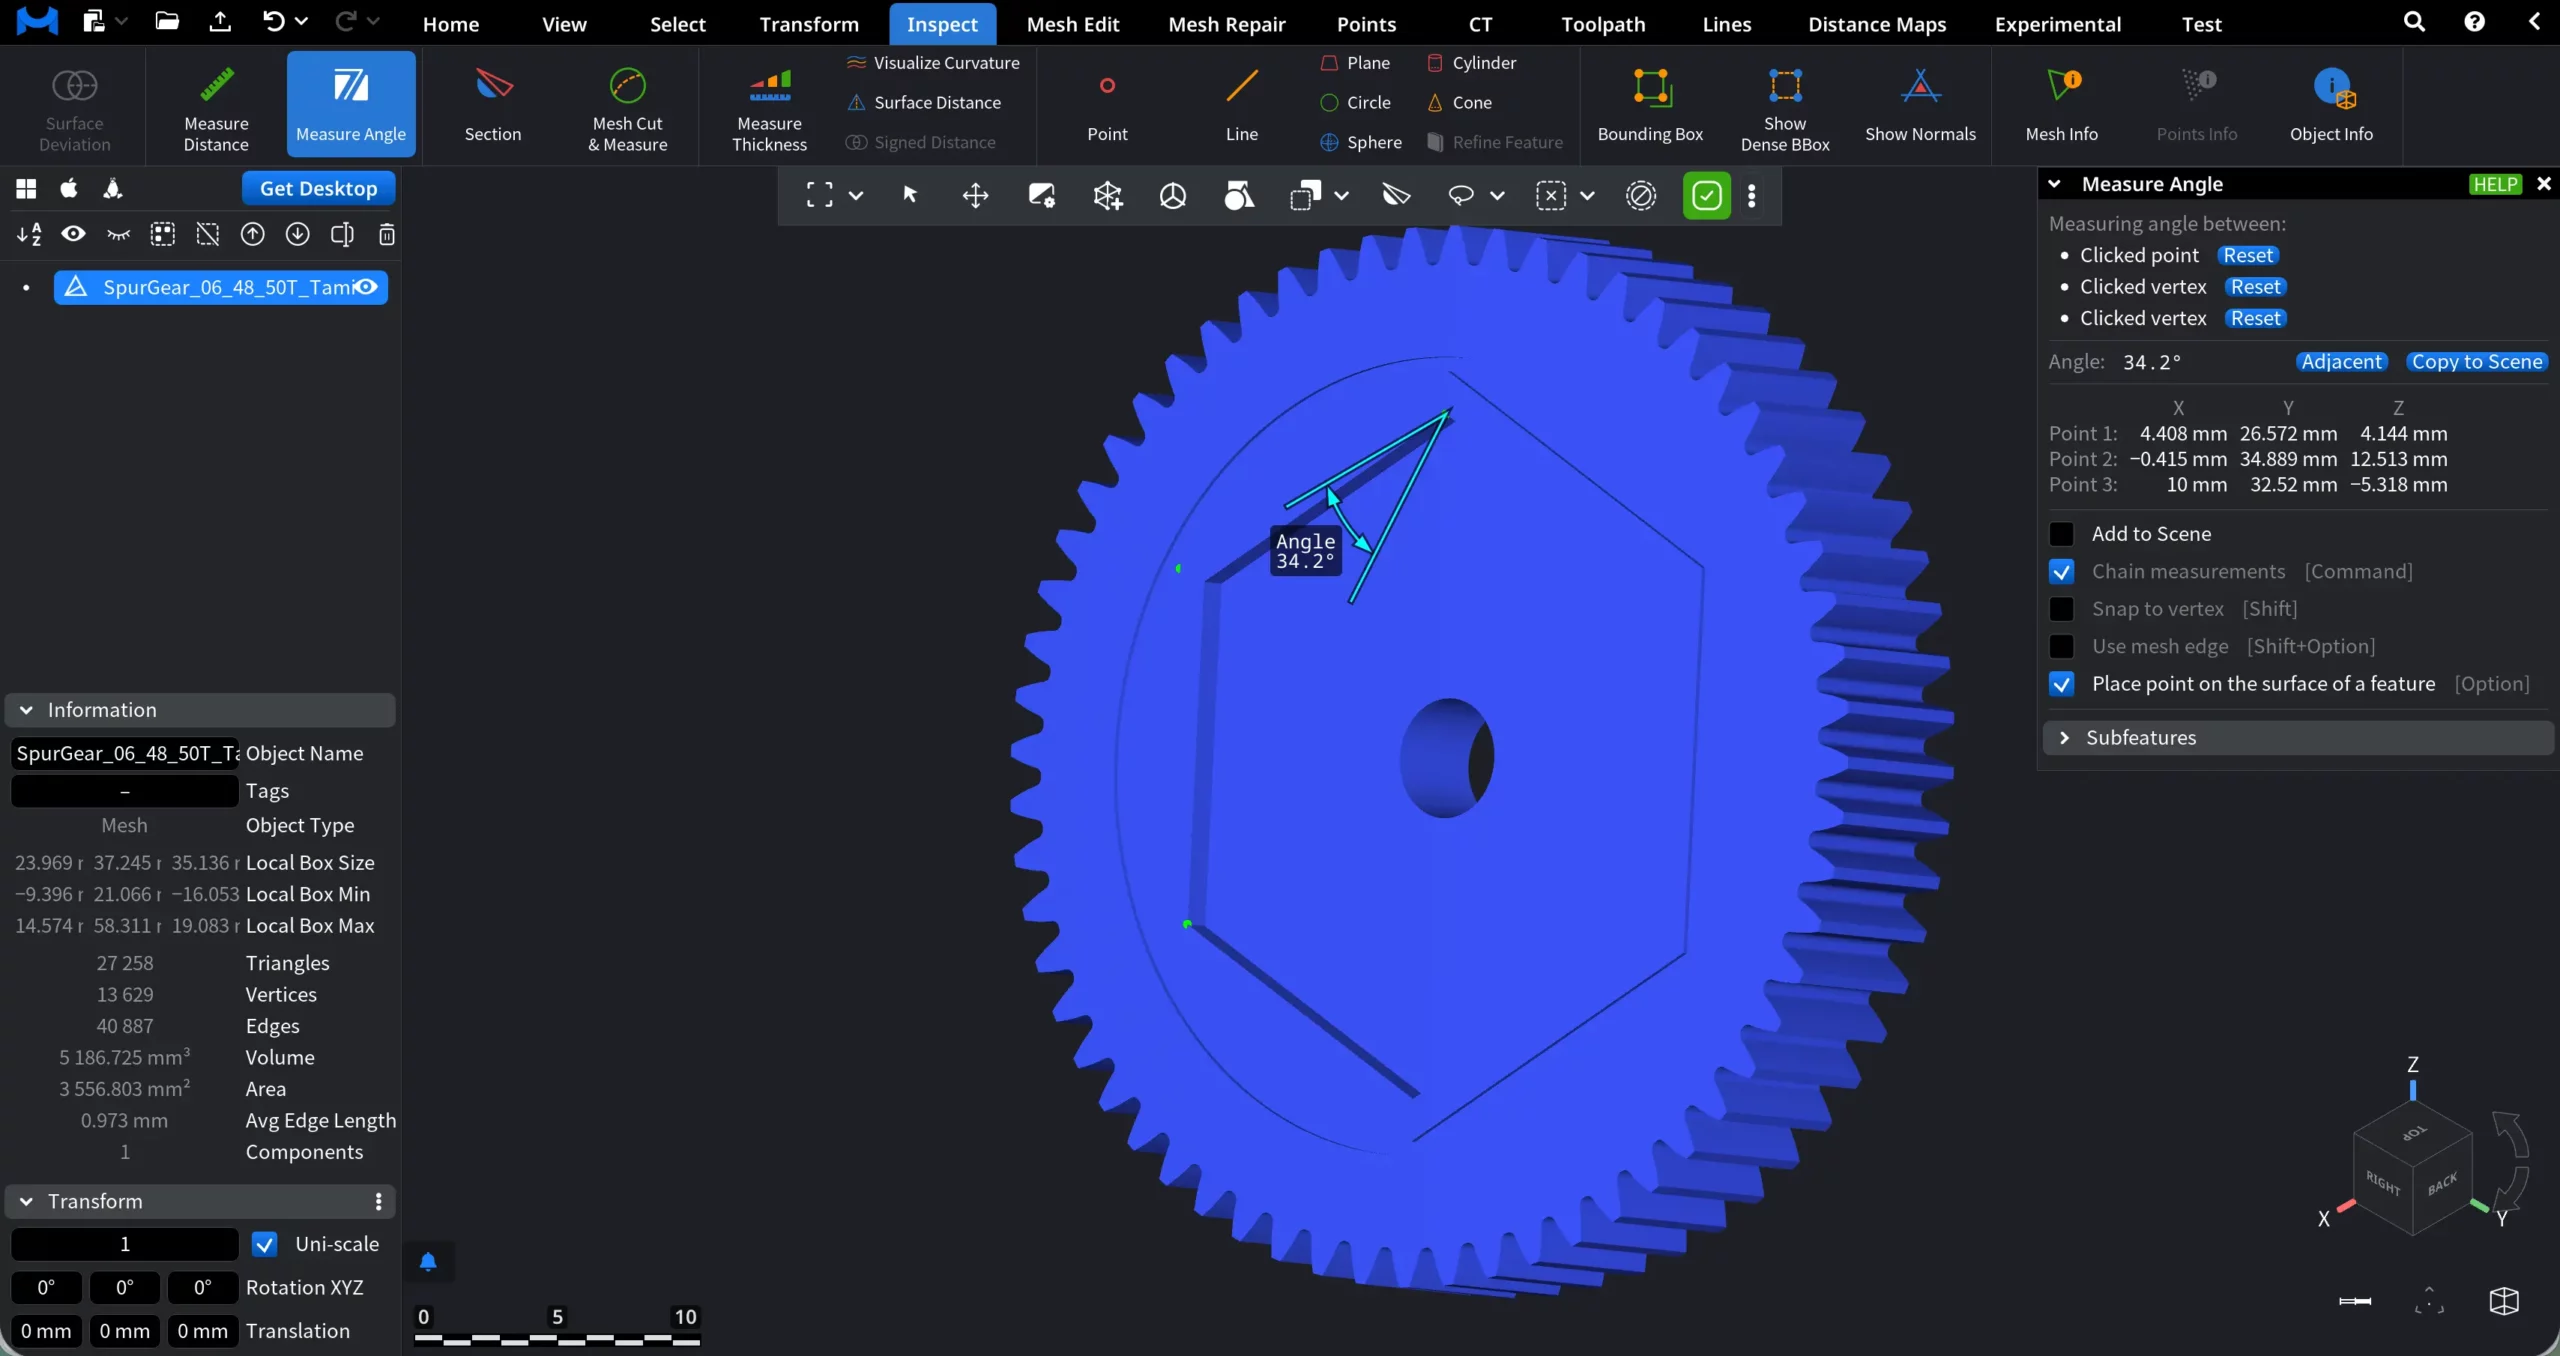
1. The first way is to assign points:
-
Default behavior. By default, when you hover the cursor over the model and click, a point is assigned at the clicked location (Point 1 in the screenshot).
-
Snap to Vertex. When Snap to Vertex is enabled (or when holding Shift while clicking), points can be placed on vertices only (Point 2 in the screenshot). This mode ensures maximum precision when working with mesh vertices.
-
Place point on the surface of a feature. When Place point on the surface of a feature is enabled (or when holding Option while clicking), points are constrained to the surface of the selected geometric feature. This option can be combined with Snap to Vertex, allowing you to control both feature context and point precision (Point 3 in the screenshot).
Any selected point can be deleted by clicking the Reset button located next to it. After that, you can add a new one.
2. The second way is to Use mesh edge (available for triangle-based objects only). When Use mesh edge is enabled (by checking the box or holding Shift and Option), angle measurement is based on existing mesh edges instead of freely placed points.
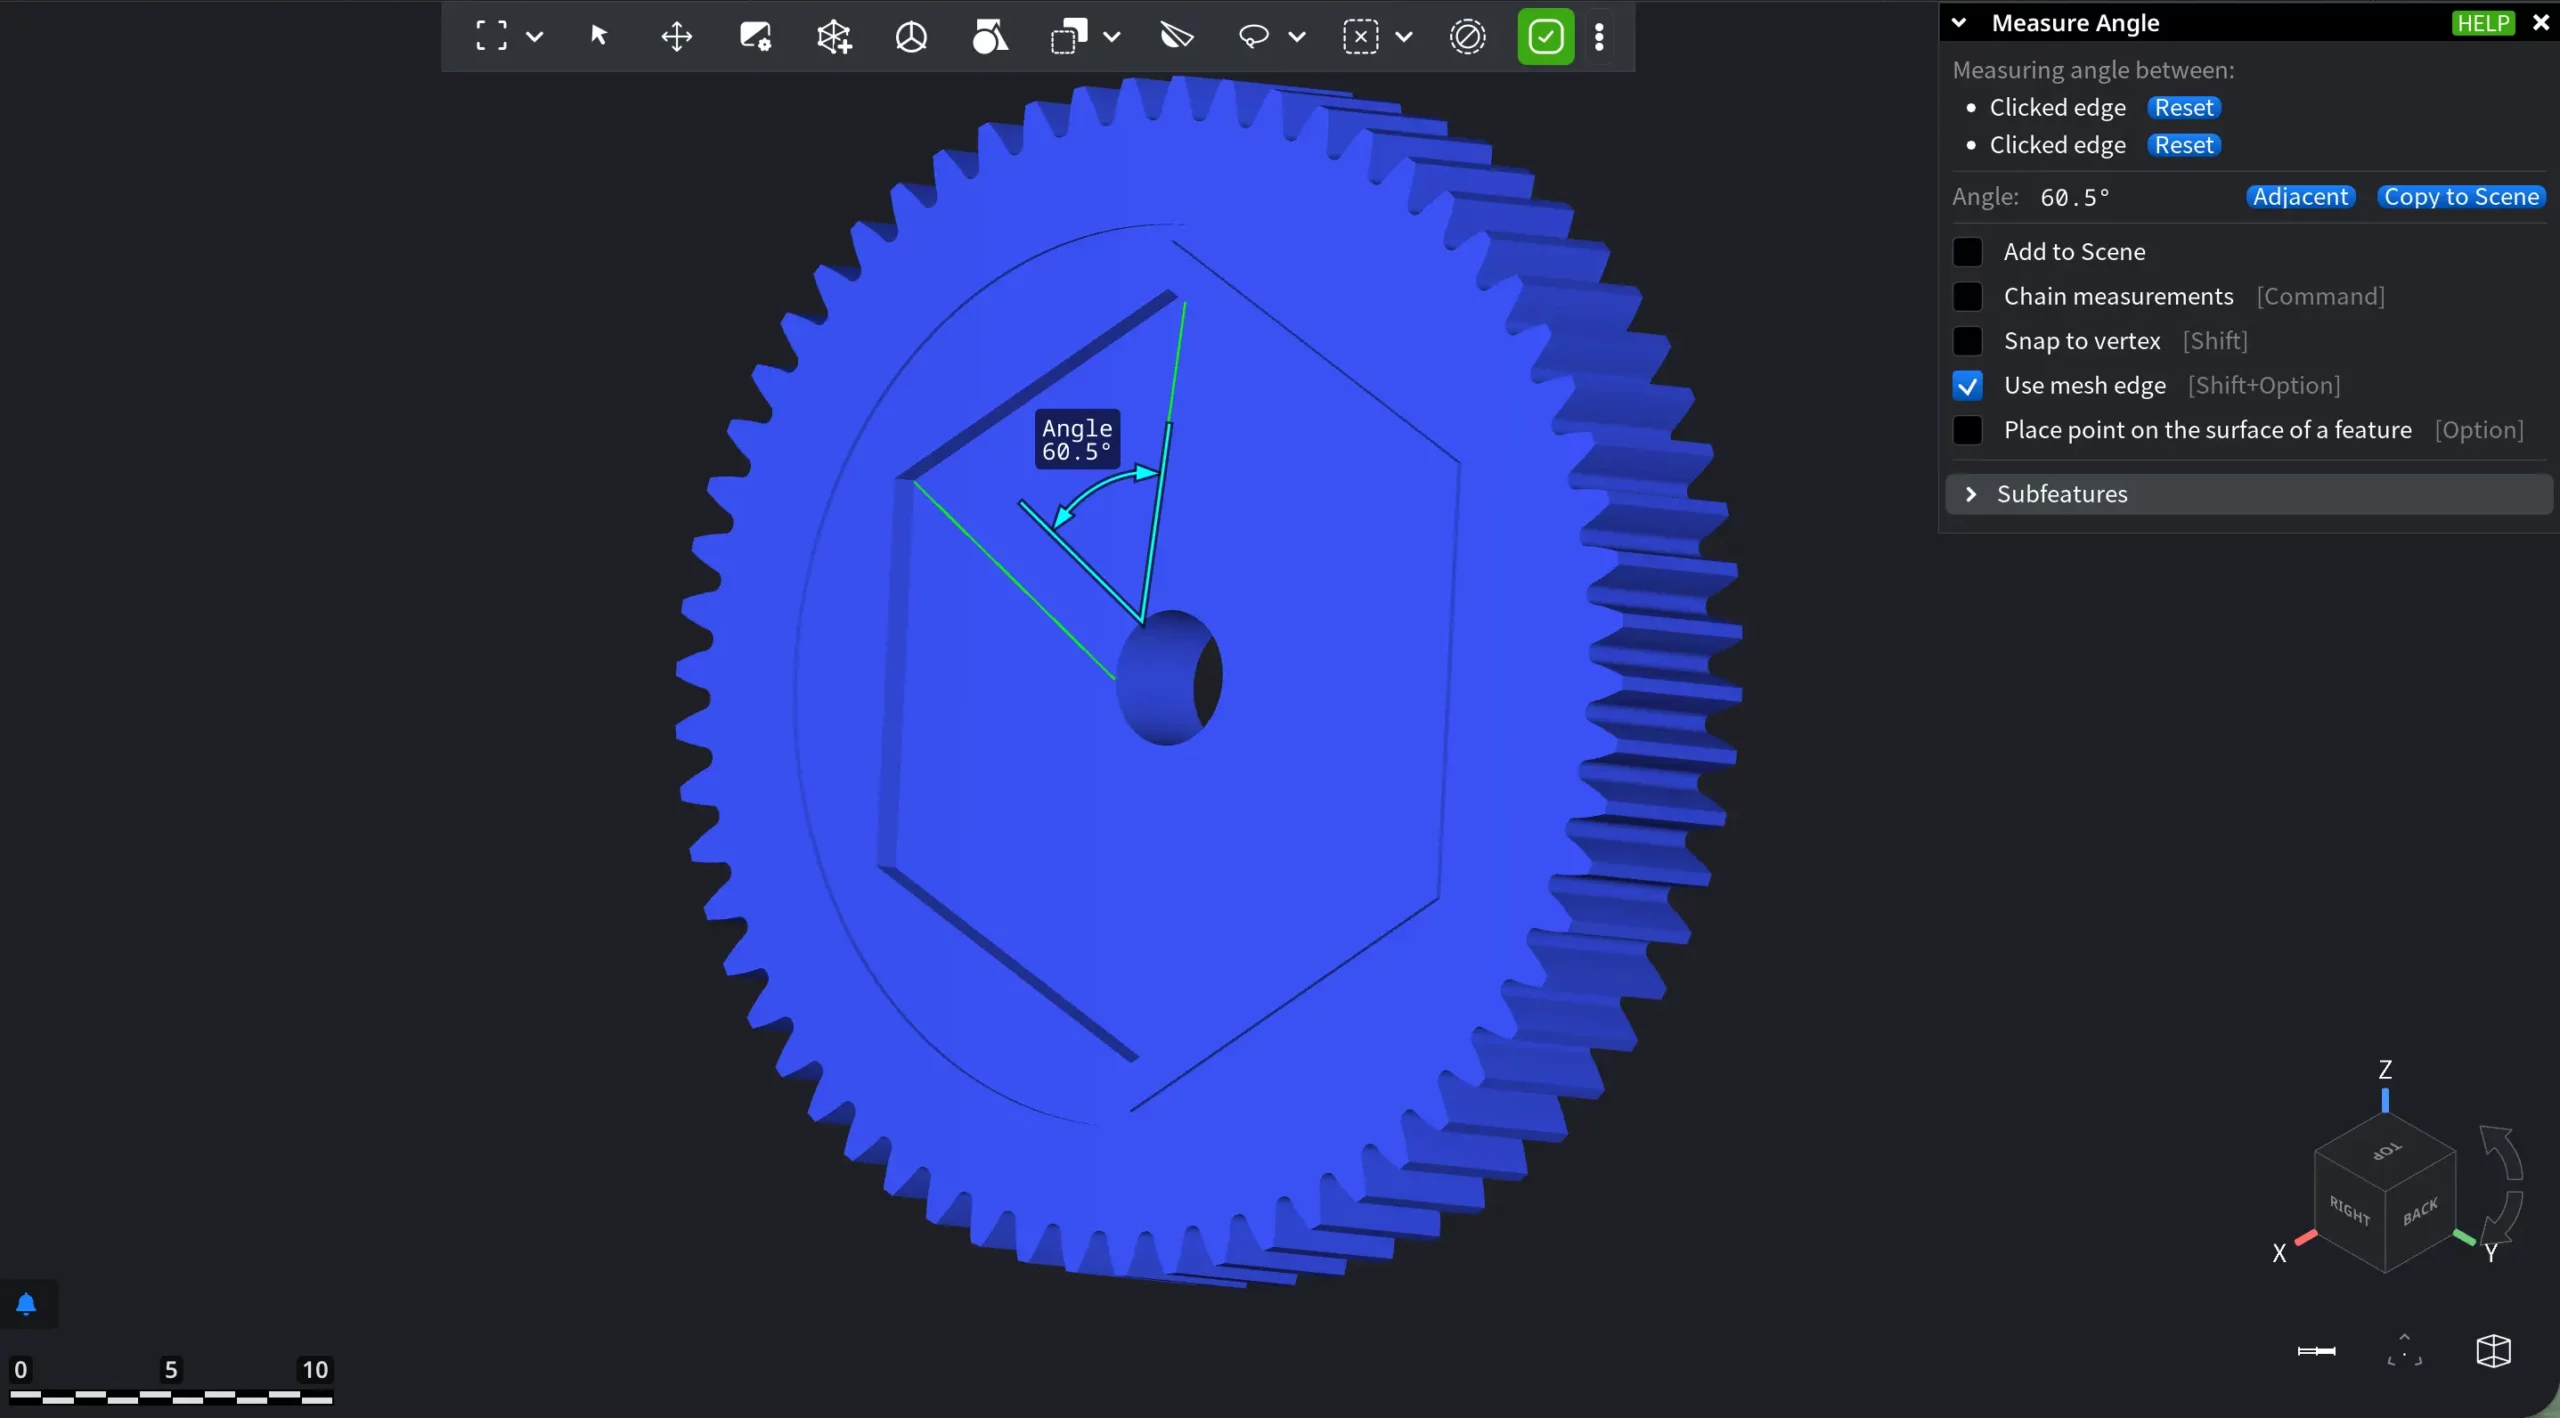
In this mode:
- Clicking on the model selects a mesh edge rather than an arbitrary surface point.
- Each selected edge defines a direction vector derived from the underlying triangle geometry.
- The measured angle is computed between the two selected edges.
Again, edges can be deleted through the blue Reset button, located next to it.
Also, with Use mesh edge, Subfeatures of the newly created measurements emerge and can be used for further calculations.
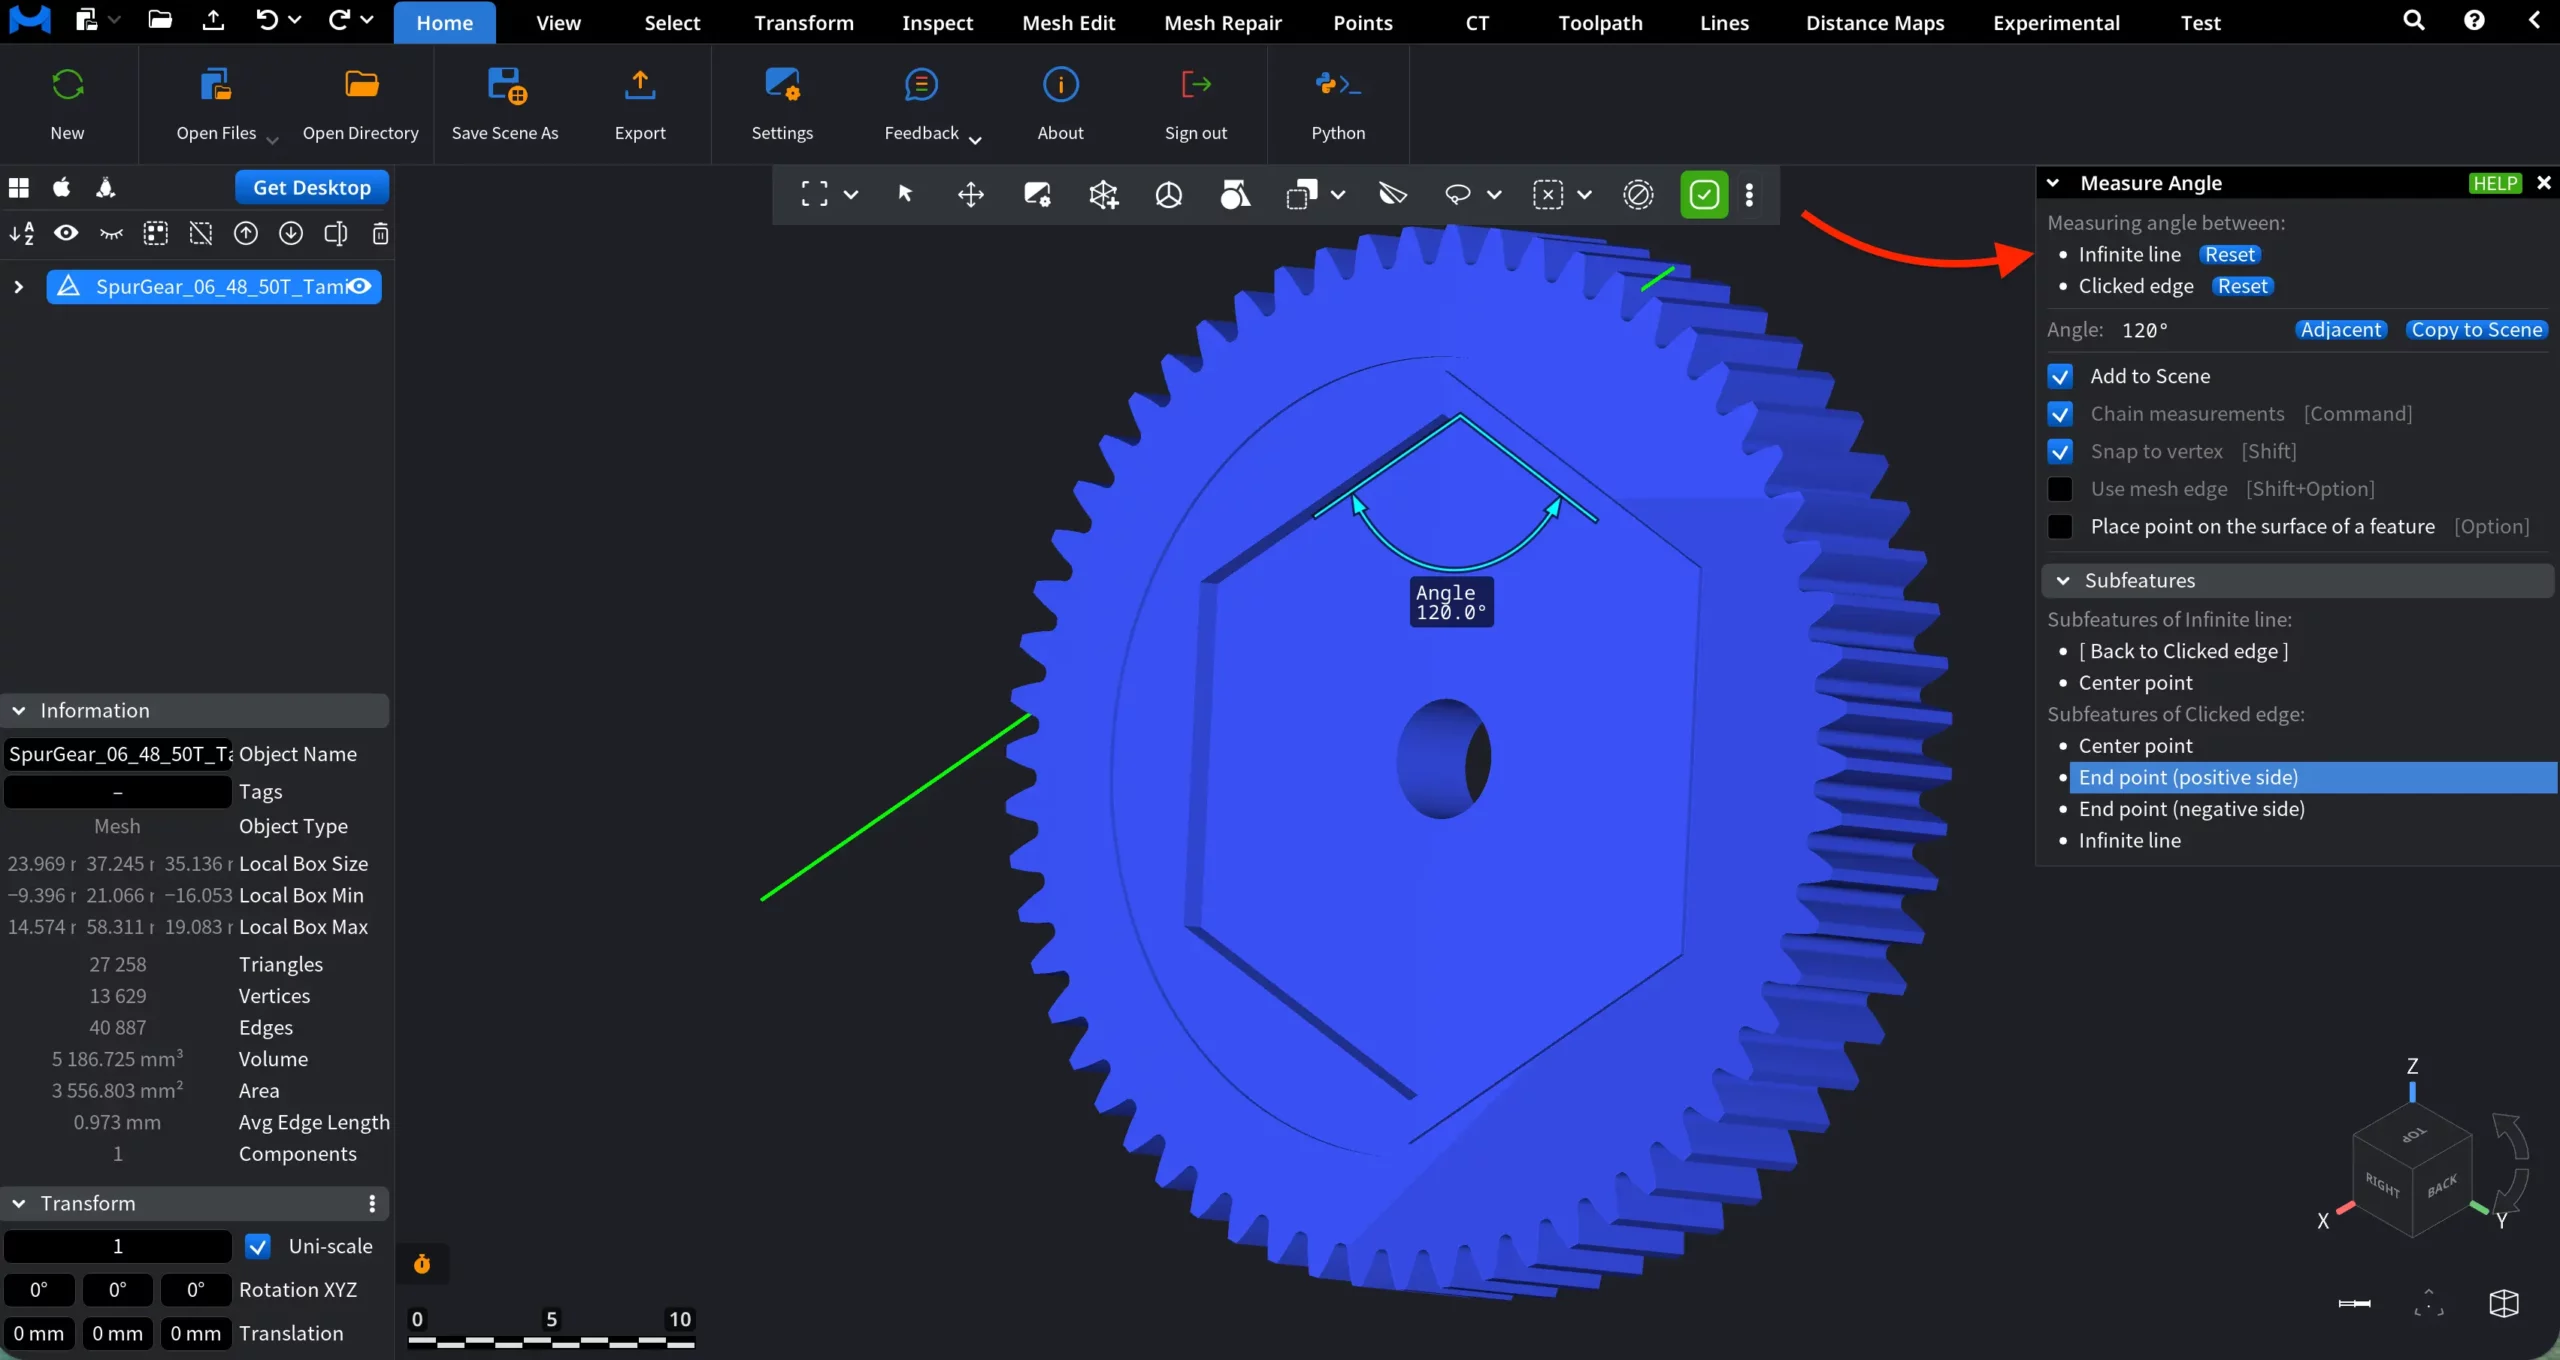
Chain measurements
If you enable Chain measurements, Measure Angle switches from a single, isolated measurement to a continuous measurement mode. In it, each new angle measurement automatically starts from the previously selected one, allowing you to build a sequence of connected angle measurements without resetting the tool.
-
Point-based measurement. When measuring angles using points, the last picked point becomes the starting point for the next angle. Each subsequent click extends the chain.
-
Mesh edge–based measurement. When Use mesh edge is enabled, the last selected edge becomes the reference for the next angle. Each new edge selection adds another angle to the chain.
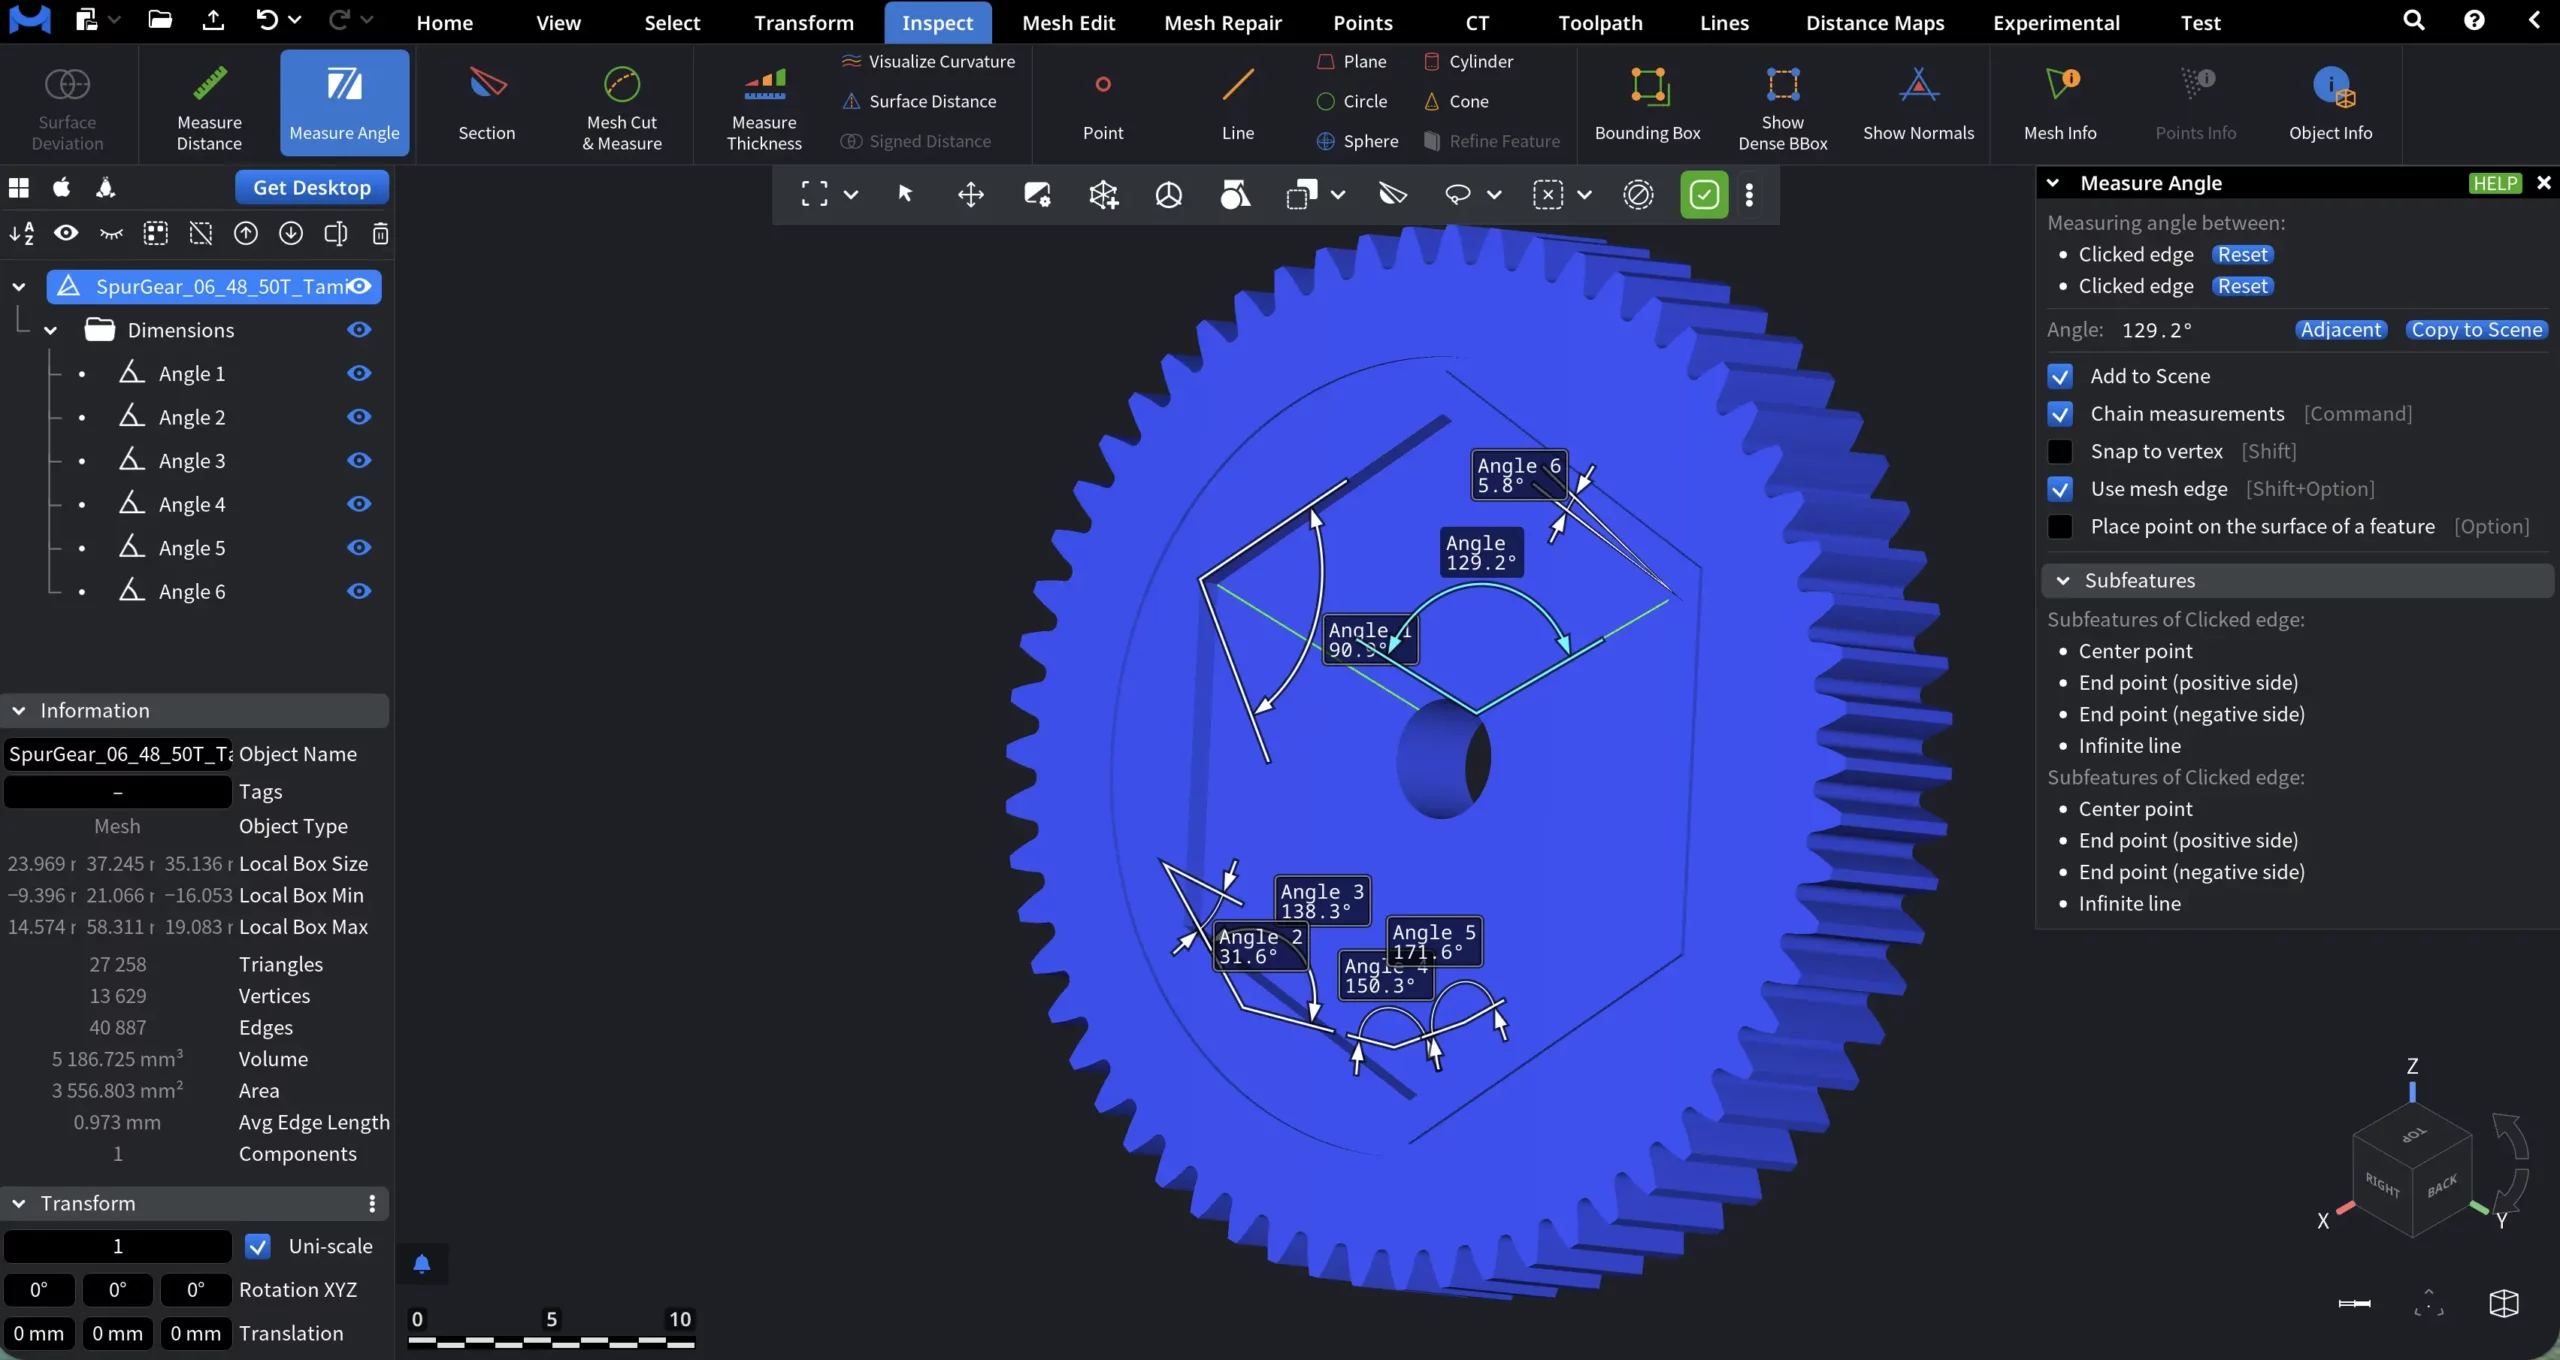
Saving the Measurement Results
With Measure Angle, the Add to Scene setting is active by default. With it, once you finalize the angle measurement by clicking on the fourth point or third edge, the results of the previous measurements are saved and added to the scene. They can also be accessed through the scene tree in the Dimensions folder.
If you disable Add to Scene, no previous results will be used and the measurement will start anew. If you want to save a particular measurement, press the blue Copy to Scene button. No new angle will be created in the scene, but the reference point or edges will be displayed. They will disappear once you start a new measurement.
Adjacent
Next to Copy to Scene button, assigned to the resulting angle , you can find Adjacent. It cycles through all valid angular sectors formed by the selected references. Each click selects the next adjacent angle in an anti-clockwise order and updates the displayed arc and value accordingly.
Section
Section is an inspection tool that creates a live cross-section of selected objects using a cutting plane. It lets you look inside geometry, analyze internal profiles, and generate precise section outlines for inspection or export.
When Section is activated, MeshInspector introduces two coordinated work elements:
-
A dedicated Section panel.
-
A Section Window that shows the resulting cross-section.
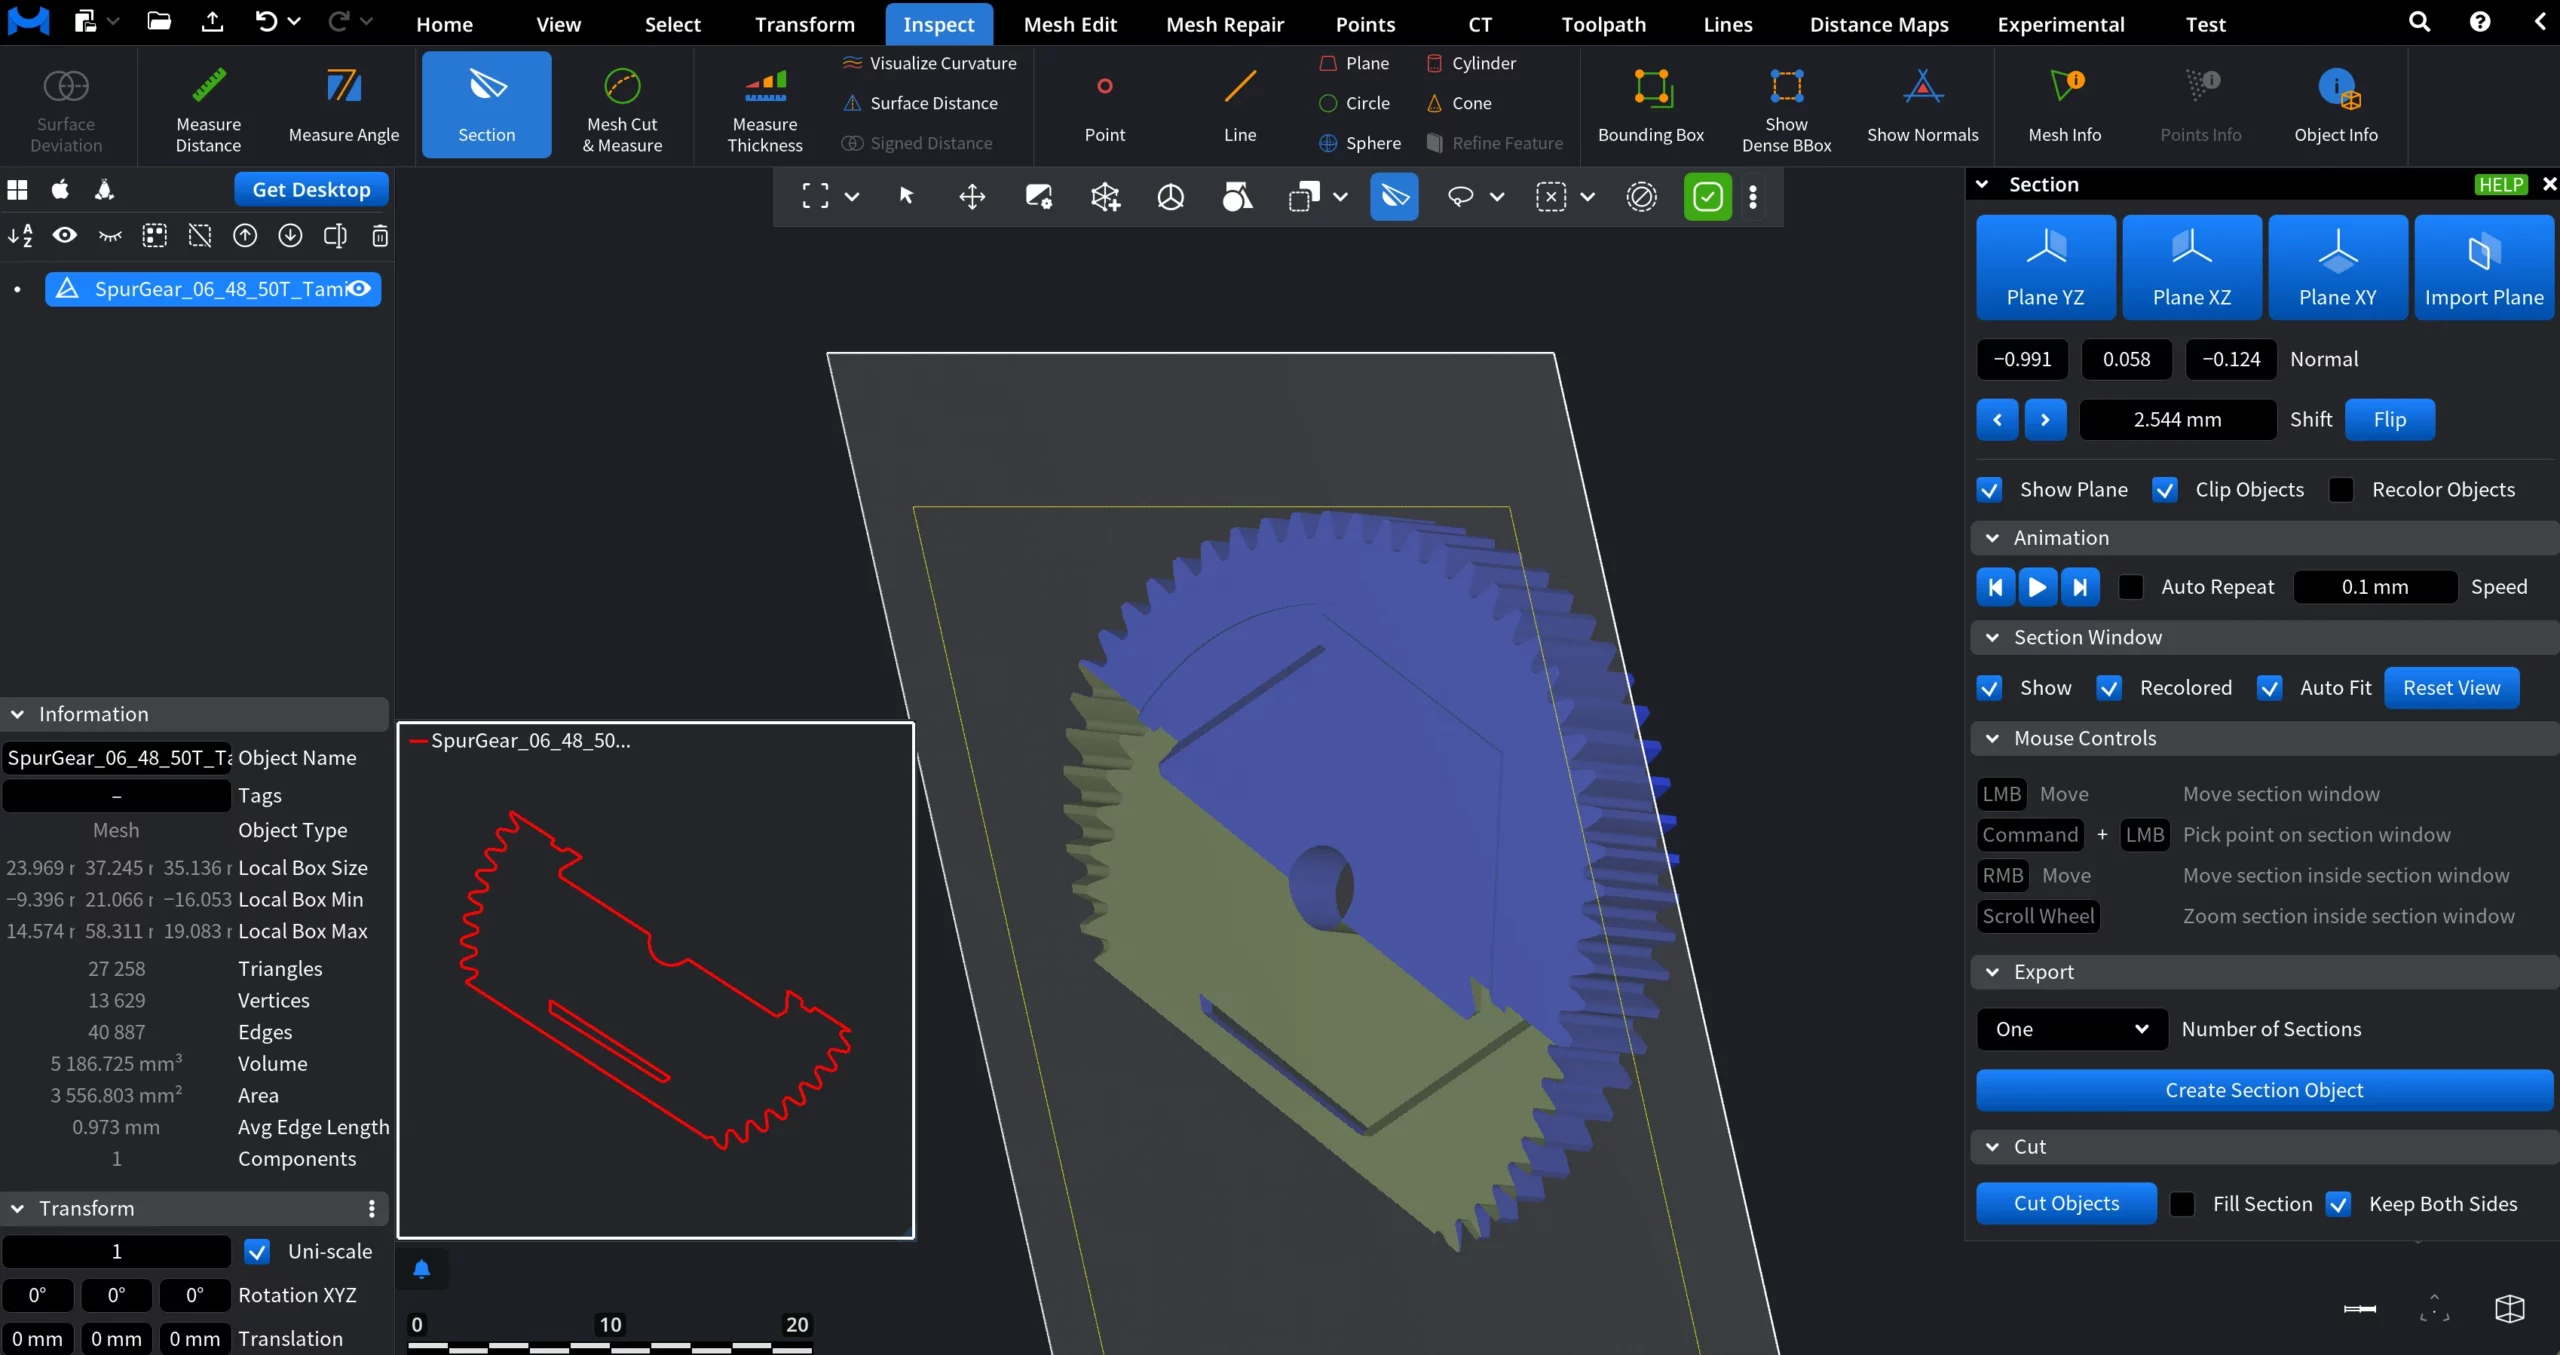
Plane: Presets and Import
At the top of the panel, you can define the orientation of the section plane:
-
Plane YZ / Plane XZ / Plane XY. Instantly aligns the section plane to one of the principal coordinate planes.
-
Import Plane. Allows you to import parameters from an existing plane object in the scene. To do this, click Import Plane, then click the already existing plane object in the viewport. The section plane adopts its orientation and position.
Plane Orientation (Normal)
Below the plane presets, the Normal fields display the plane’s normal vector as X, Y, and Z components.
-
These values define the plane’s orientation in 3D space.
-
The normal values update automatically when you manipulate the plane: either by dragging it in the viewport, entering new values manually into any of the Normal fields, or by clicking and holding the mouse button (or touchpad), dragging to define a direction, and releasing.
Plane Offset and Direction
-
Shift moves the section plane along its normal direction by the specified offset value.
-
Arrow buttons incrementally move the plane forward or backward along the normal.
-
Flip reverses the direction of the plane’s normal. This affects clipping direction and which side of the geometry is considered “front” or “back.”
Display and Clipping
Show Plane controls only the visibility of the section plane surface. The section line remains visible even when the plane is hidden.
Clip Objects hides geometry on one side of the section plane in the main viewport, creating a cutaway view.
Recolor Objects assigns colors to individual objects, active in the scene (i.e., including those selected in the scene greet, but not affected by the Section tool) improving visual separation.
Playback Controls
The animation controls consist of three buttons:
- Move to minimum instantly shifts the section plane to its lowest reachable position along the normal direction.
- Play / Pause starts or pauses continuous movement of the section plane along the normal.
- Move to maximum instantly shifts the section plane to its highest reachable position along the normal direction.
Auto Repeat, when enabled, does the following: once the section plane reaches its maximum extreme, the movement restarts from the minimum extreme and continues again in the same direction. When disabled, the movement stops after reaching the current extreme.
Speed controls how quick the section line advances through the object during animation. You can adjust this value both by dragging the Speed field or by entering a value manually.
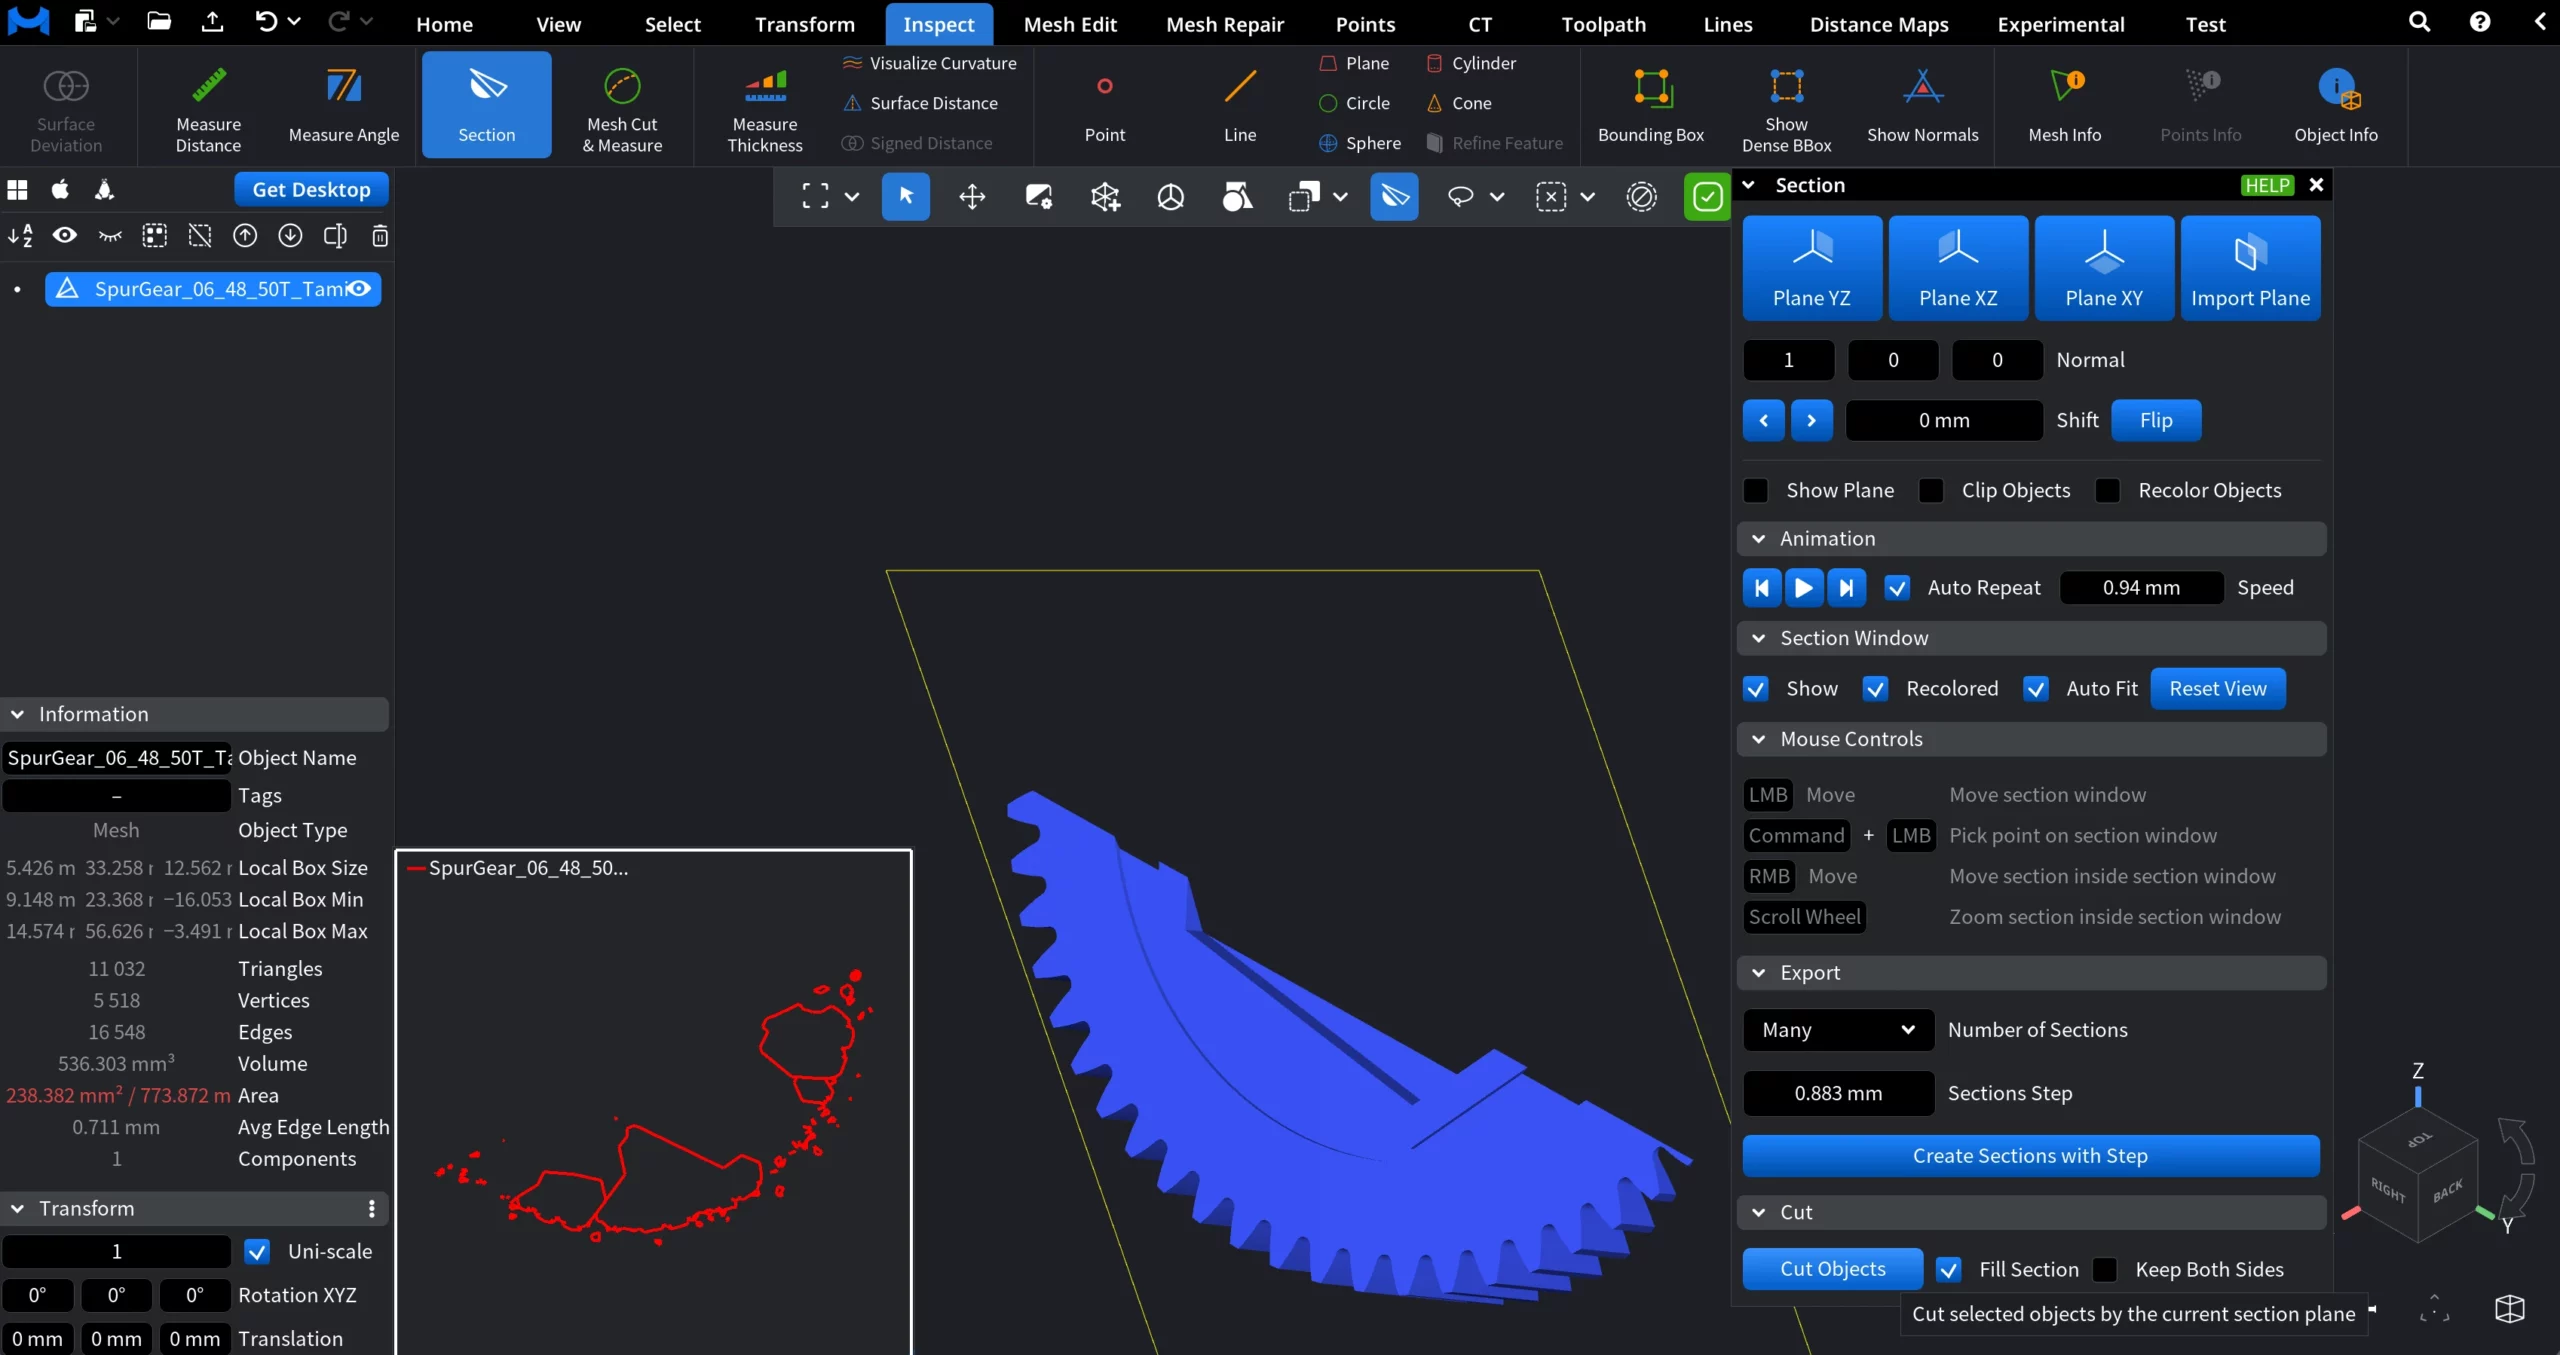
Section Window: Settings
The Section Window displays the resulting 2D cross-section generated by the active section plane. The three main settings include:
Show, when enabled, makes the Section Window visible. When it is disabled, the Section Window is hidden, while the section operation itself remains active.
Recolored, when enabled, makes the section outlines in the Section Window inherit the same object-based colors assigned to them (via Recolor Objects). When disabled, section outlines are displayed using a uniform default color.
Auto Fit, when enabled, makes the Section Window automatically pan and zoom to fit the currently visible section outlines.
Reset View resets the Section Window zoom and position to fit the current section outline.
Mouse Controls
The Mouse Controls section lists all mouse interactions available inside the Section Window.
The Mouse Controls section lists all mouse interactions available inside the Section Window. These controls apply only when the cursor is positioned over the Section Window and do not affect the main viewport, geometry, or the section plane.
-
LMB — Move moves the Section Window.
-
Command + LMB pick a point in the Section Window.
-
RMB — Move pan the section view inside the Section Window.
-
Scroll Wheel zoom the section view inside the Section Window.
Export
The Export section controls how section results are converted into standalone section objects.
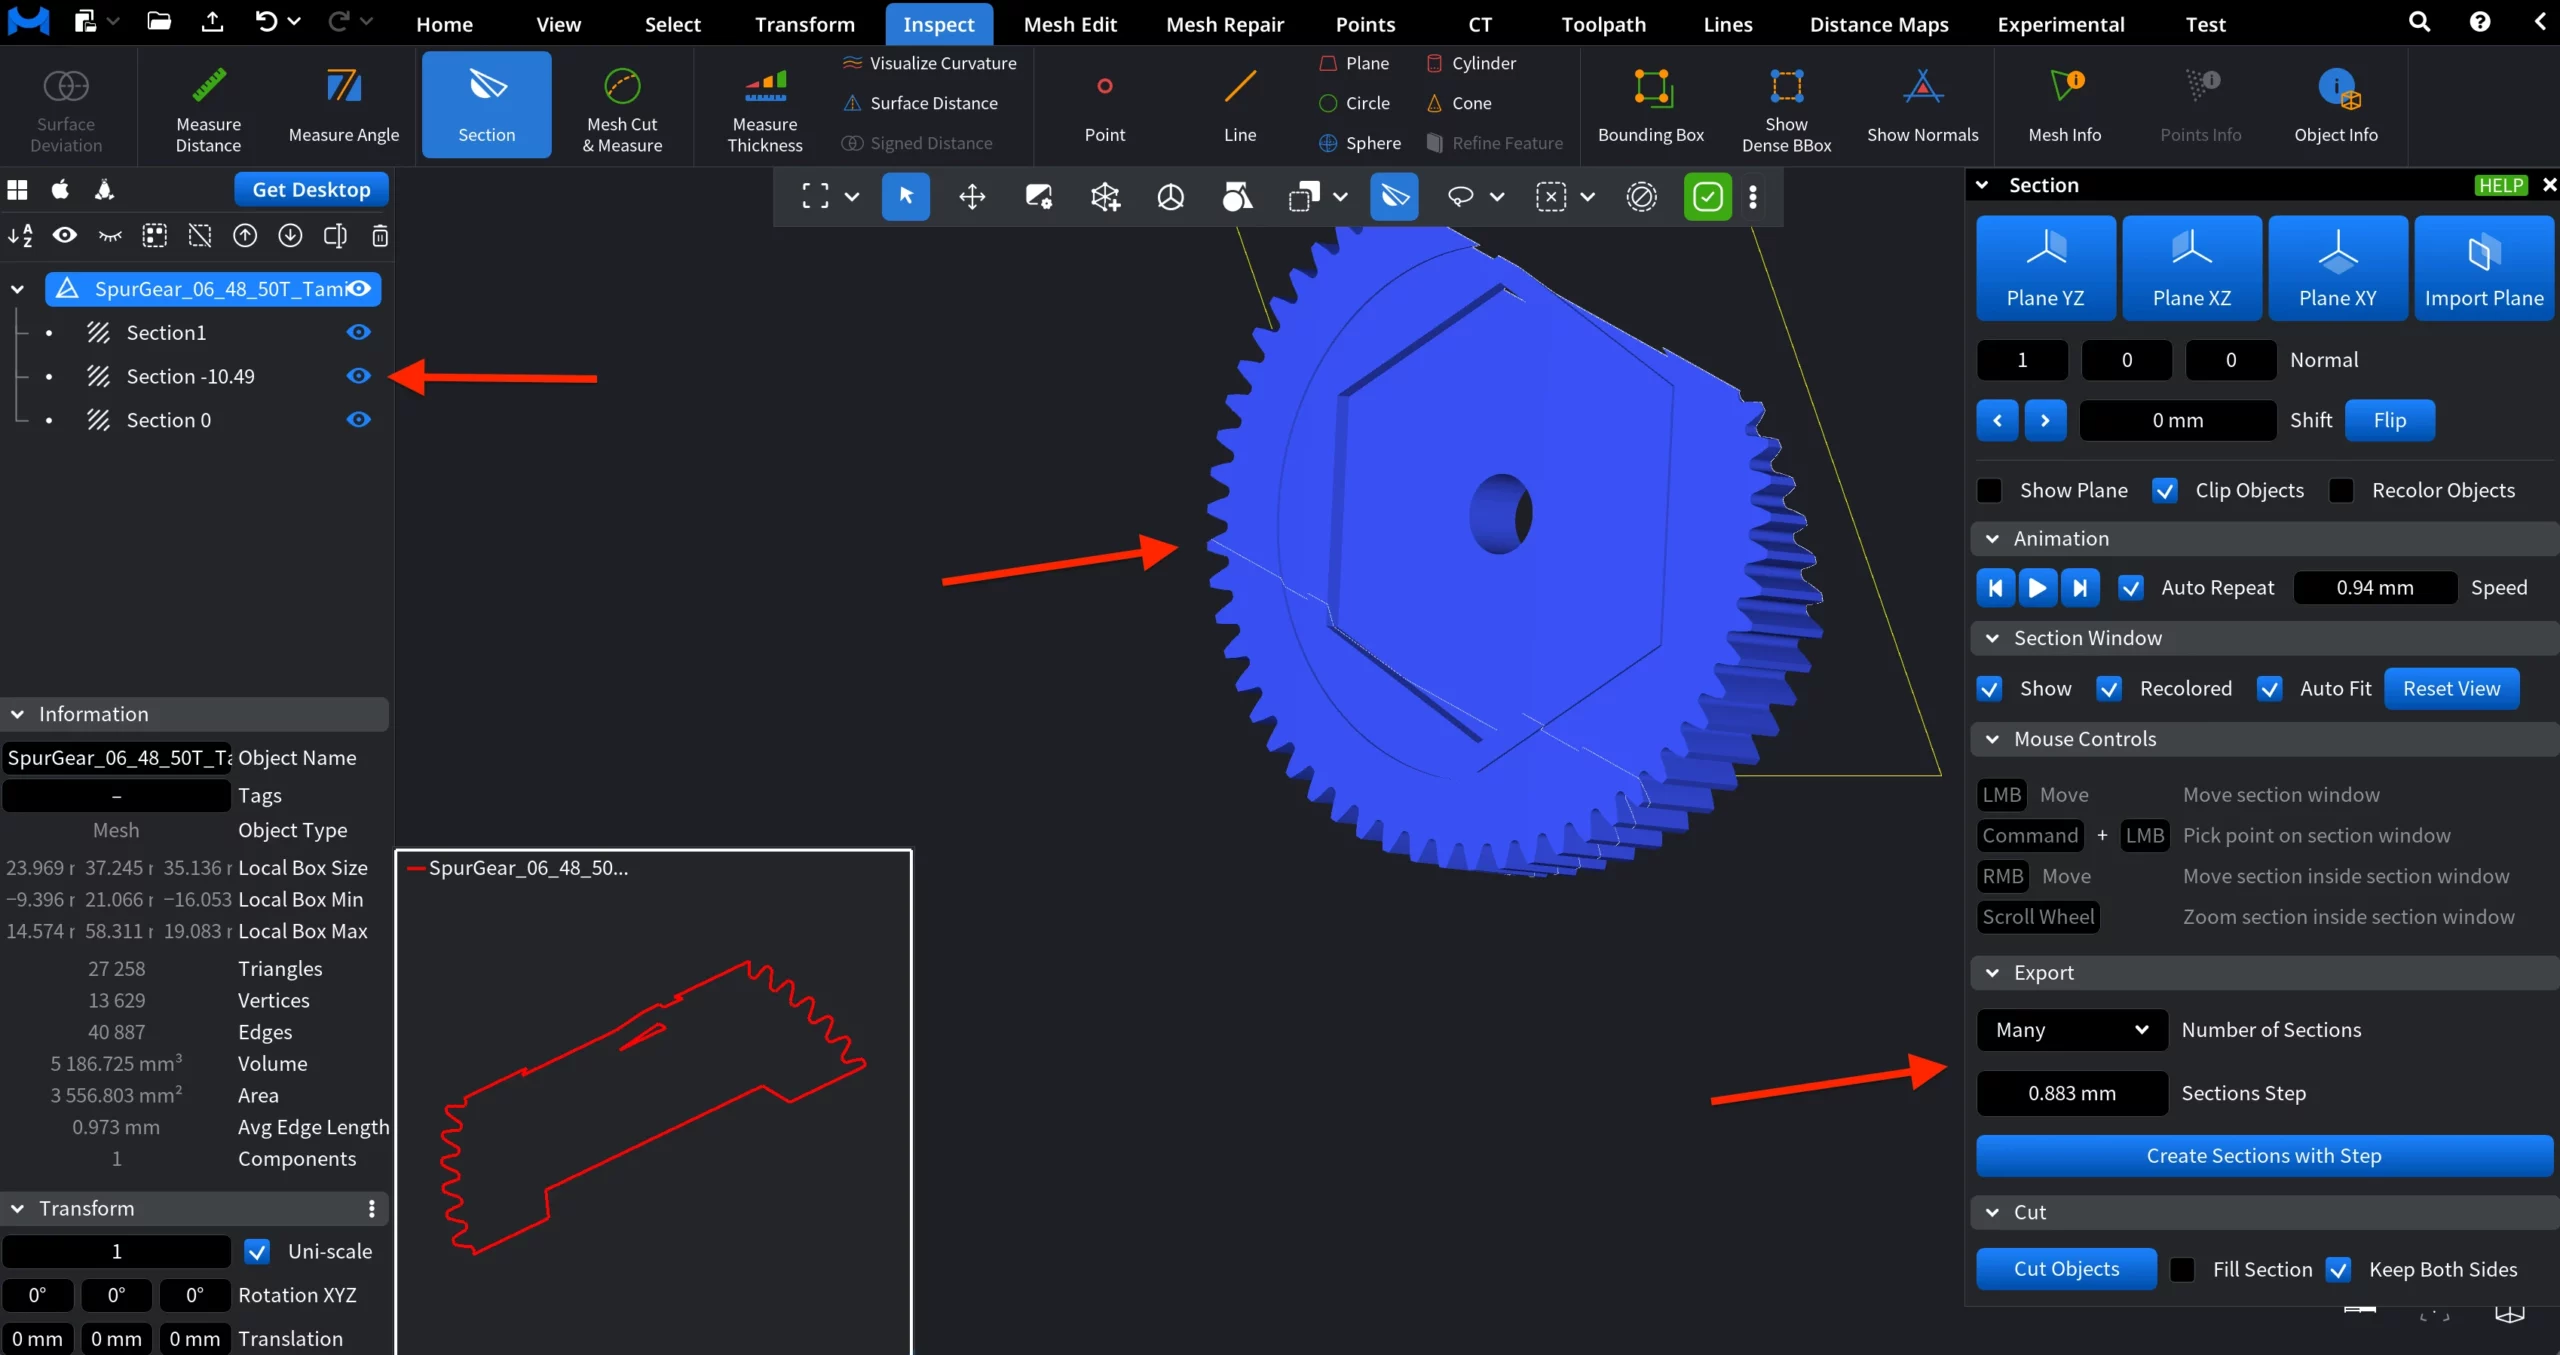
Number of Sections defines how many section objects will be generated from the current section plane setup.
-
One creates a single section object at the current position of the section plane.
-
Many creates multiple section objects distributed along the section plane’s normal direction.
Sections Step (available when Many is selected) specifies the distance between consecutive section planes when generating multiple sections.
-
The value is measured along the section plane’s normal.
-
Each generated section is offset from the previous one by this step distance.
Create Section Object or Create Sections with Step
-
Create Section Object generates a single section object using the current section plane position.
-
Create Sections with Step generates multiple section objects based on the selected Sections Step value.
After creation each section appears as a separate object in the object tree.
Cut
The Cut section applies the active section plane to the selected objects and generates new geometry.
Cut Objects splits the selected objects using the current section plane, creating new objects from each original one.
Fill Section caps the open cut surfaces with newly generated triangles when enabled.
Keep Both Sides determines whether both sides of the cut are preserved or only one side is kept.
Mesh Cut & Measure
The Mesh Cut & Measure tool lets you cut a mesh along a user-defined path and measure its exact length. Two modes are available:
Path Modes
- Geodesic Line creates a path that follows the shortest route along the mesh surface between control points.
- Spline creates a smooth spline curve passing through the user-defined control points.
Close Path determines whether the path is treated as open or closed. When Close Path is disabled, the path remains open. You can continue adding control points, and the cut (or measurement) is based on a single continuous line. When Close Path is enabled, the last control point is automatically connected back to the first one, forming a closed loop.
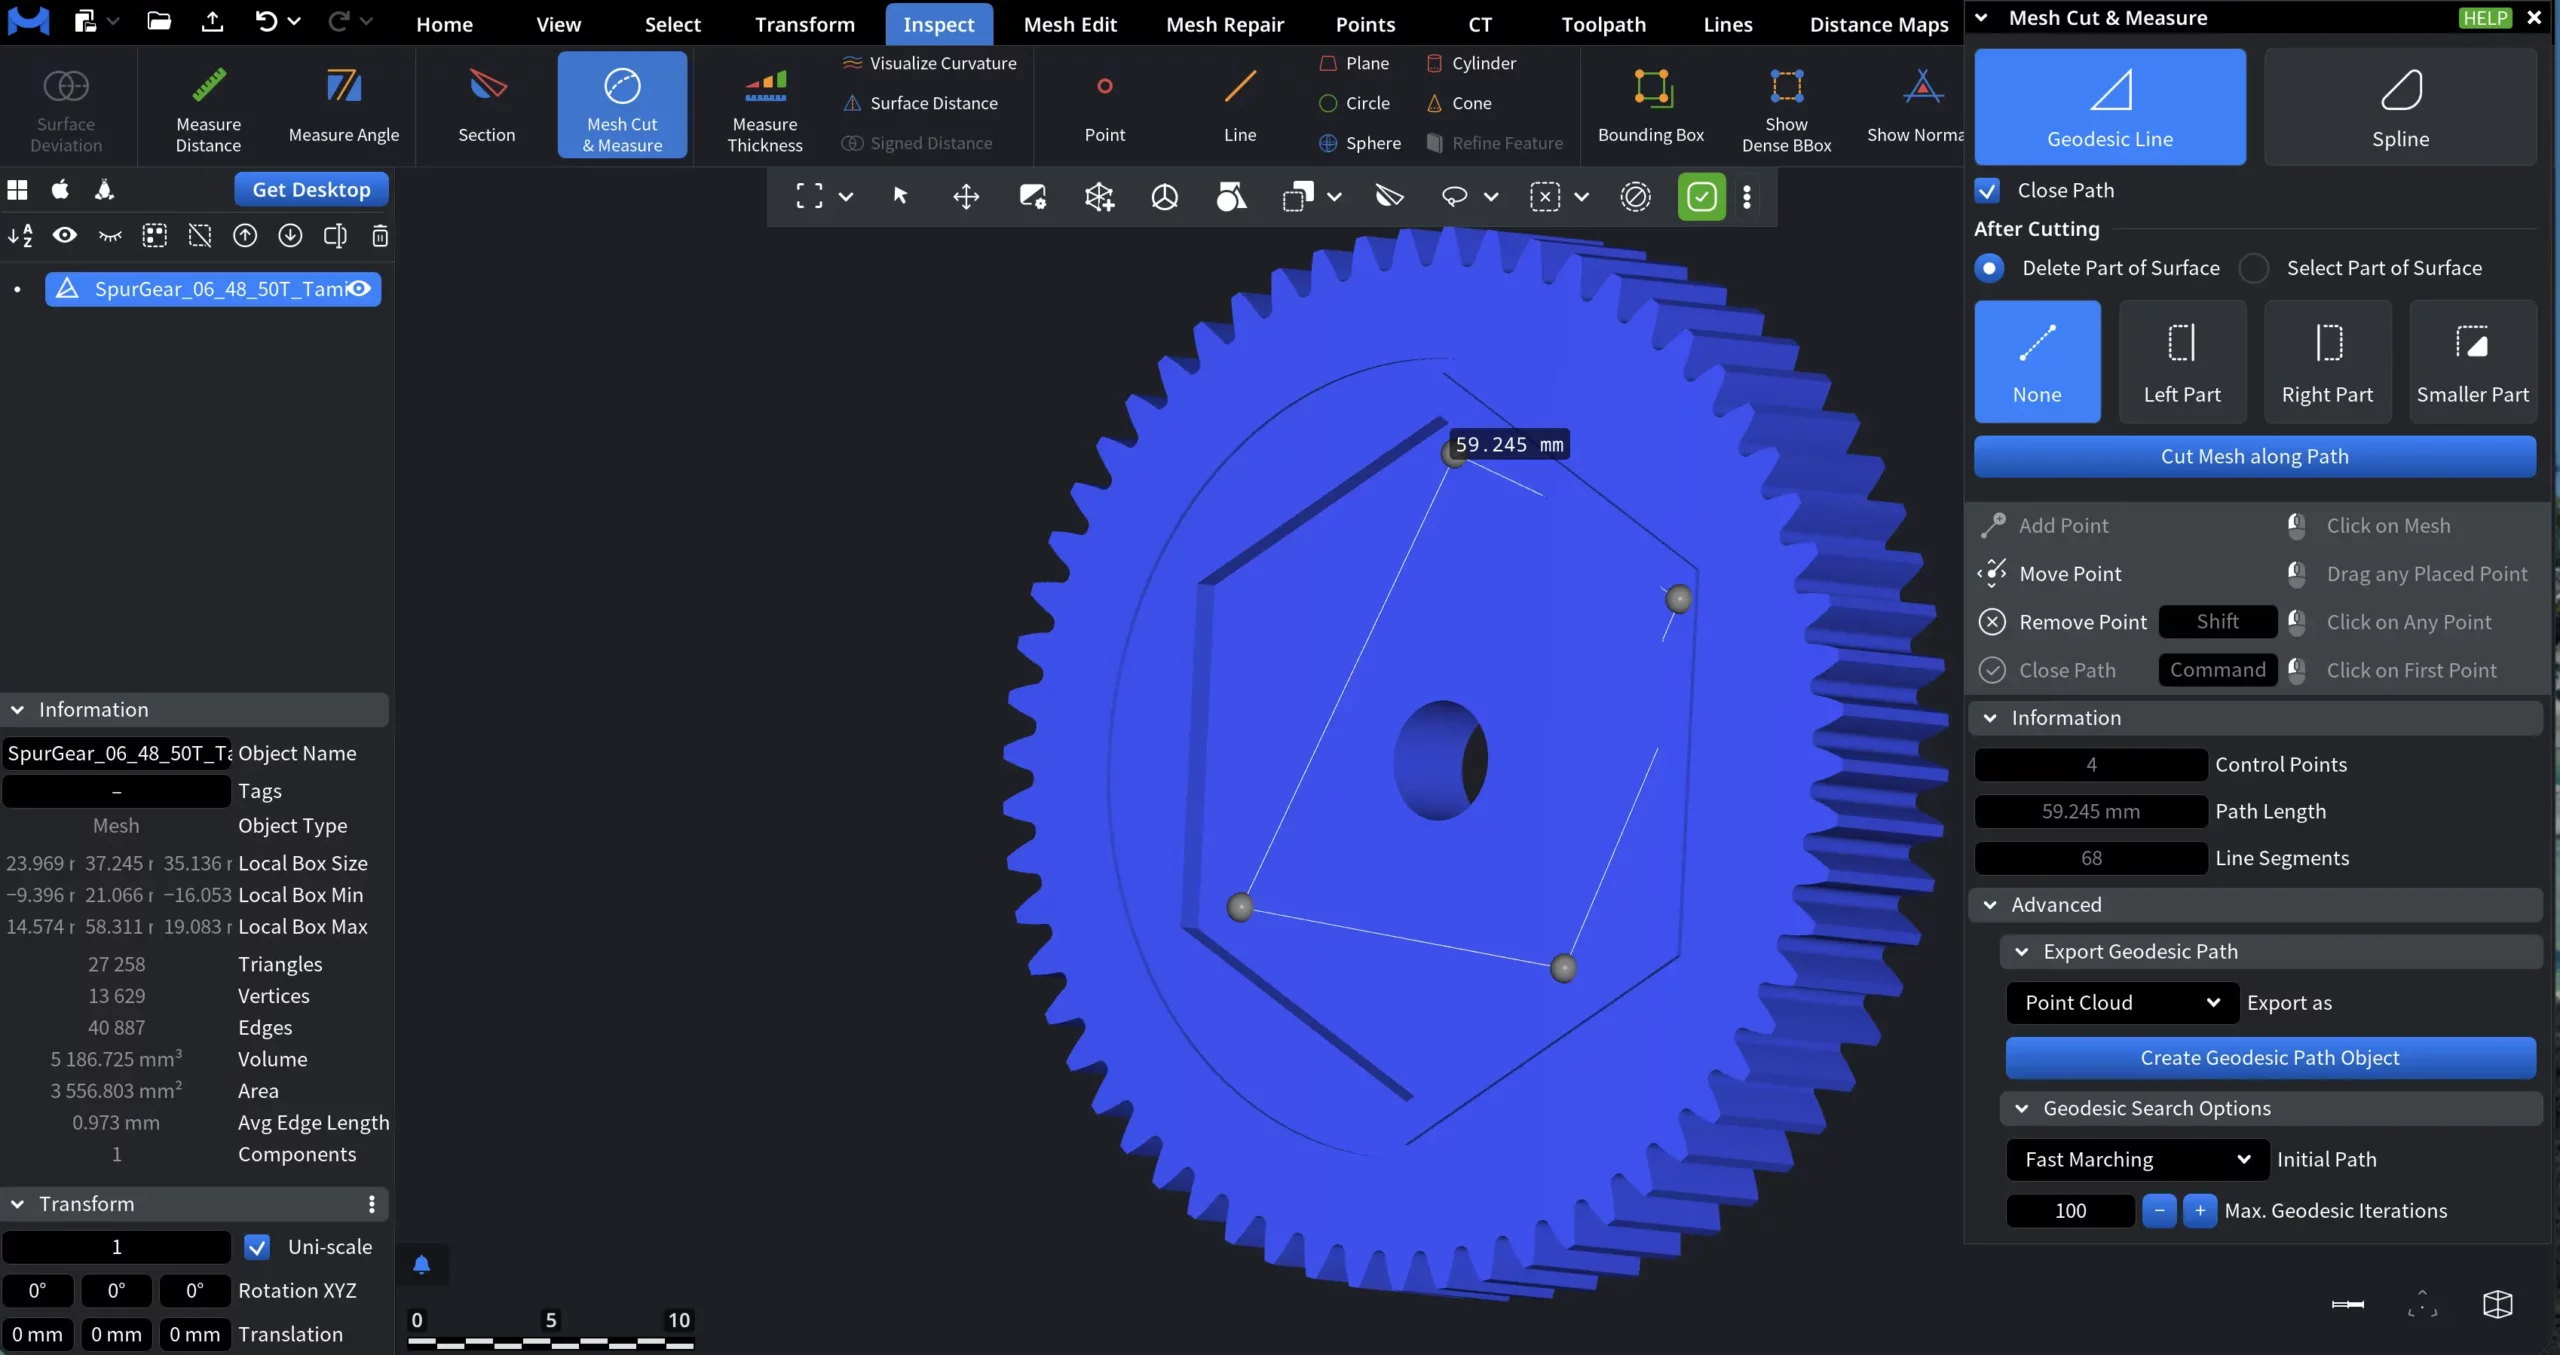
After Cutting
The After Cutting section defines what happens to the surface regions created by the cut.
Delete Part of Surface. When Delete Part of Surface is enabled, MeshInspector removes surface triangles on the selected side of the cut contour.
You can choose which side to delete using the following options:
-
Left Part deletes the surface on the left side of the contour, relative to the path direction.
-
Right Part deletes the surface on the right side of the contour, relative to the path direction.
-
Smaller Part automatically deletes the smaller of the two surface regions formed by the closed contour.
-
None does not delete any surface. The mesh is split along the contour, and the edges created by the cut are generated and selected, but no surface triangles are removed.
This mode is typically used to trim geometry or create openings by removing part of the mesh.
Select Part of Surface
When Select Part of Surface is enabled, MeshInspector does not modify the geometry.
Instead, it selects surface triangles on one side of the cut contour.
The same side-selection options apply:
-
Left Part selects surface triangles on the left side of the contour.
-
Right Part selects surface triangles on the right side of the contour.
-
Smaller Part selects the smaller of the two surface regions.
-
None does not select any surface region. The mesh is split along the contour, and the edges created by the cut are generated and selected.
This mode is useful for isolating regions for further operations, such as inspection, measurement, coloring, or applying additional tools, without permanently altering the mesh.
Cut Mesh along Path
Cut Mesh along Path applies the currently defined path to the mesh and performs the actual cutting operation.
Information
The Information section provides read-only metrics describing the currently defined path:
- Control Points displays the total number of user-defined control points used to construct the path.
- Path Length shows the total length of the constructed path, measured along the mesh surface.
- Line Segments indicates the number of linear segments used internally to represent the path.
Advanced Settings for Geodesic Line
The Advanced section provides additional controls for exporting the geodesic path and configuring how the path is computed on the mesh surface.
Export Geodesic Path
This section controls how the constructed geodesic path is converted into a scene object.
Export as specifies the type of object created from the geodesic path:
-
Point Cloud creates a new point cloud object containing points sampled along the geodesic path, including surface normals.
-
Polyline creates a new line object representing the geodesic path as connected line segments.
Create Geodesic Path Object creates a new scene object of the selected type using the current geodesic path.
Geodesic Search Options controls how the initial geodesic path is computed before refinement.
-
Initial Path defines the algorithm used to construct the initial approximation of the geodesic path:
-
Fast Marching computes an initial path that is typically closer to the shortest geodesic, but may take longer to calculate.
-
Dijkstra A* uses an A* modification of Dijkstra’s algorithm. Generally fast for near-linear paths, but may be slower when the path deviates significantly from a straight line.
-
Dijkstra bidir. uses a bidirectional version of Dijkstra’s algorithm. Usually fast, but may produce a path that is not the shortest geodesic compared to Fast Marching.
-
-
Max. Geodesic Iterations sets the maximum number of refinement iterations applied to improve the geodesic path after the initial approximation:
-
Higher values may improve path accuracy.
-
Lower values reduce computation time.
-
Advanced Settings for Spline
Spline Options controls how the spline is constructed and refined on the surface.
- Show Geodesic Path as well displays the underlying geodesic path connecting spline control points.
- Max Distance sets the maximum allowed distance between spline points and the geodesic path.
- Add Control Point inserts a new control point at the location where the spline deviates most from the geodesic path.
- Respect Normals forces the spline to remain orthogonal to mesh normals at control points.
- Sampling Step defines the spacing used when inserting additional points between control points.
- Control Stability controls how strongly the spline follows the defined control points.
- Construction Iterations sets the number of refinement iterations used to build the spline.
Export Spline
Export as defines the output type for the spline:
- Point Cloud creates a point cloud representation of the spline.
- Polyline creates a line object representing the spline.
Geodesic Search Options
Here, Spline settings are identical to Geodesic Path.
Measure Thickness
The Measure Thickness tool visualizes and measures the local thickness of a mesh by analyzing distances between opposite surface regions. Thickness values are displayed directly on the mesh using a color map.
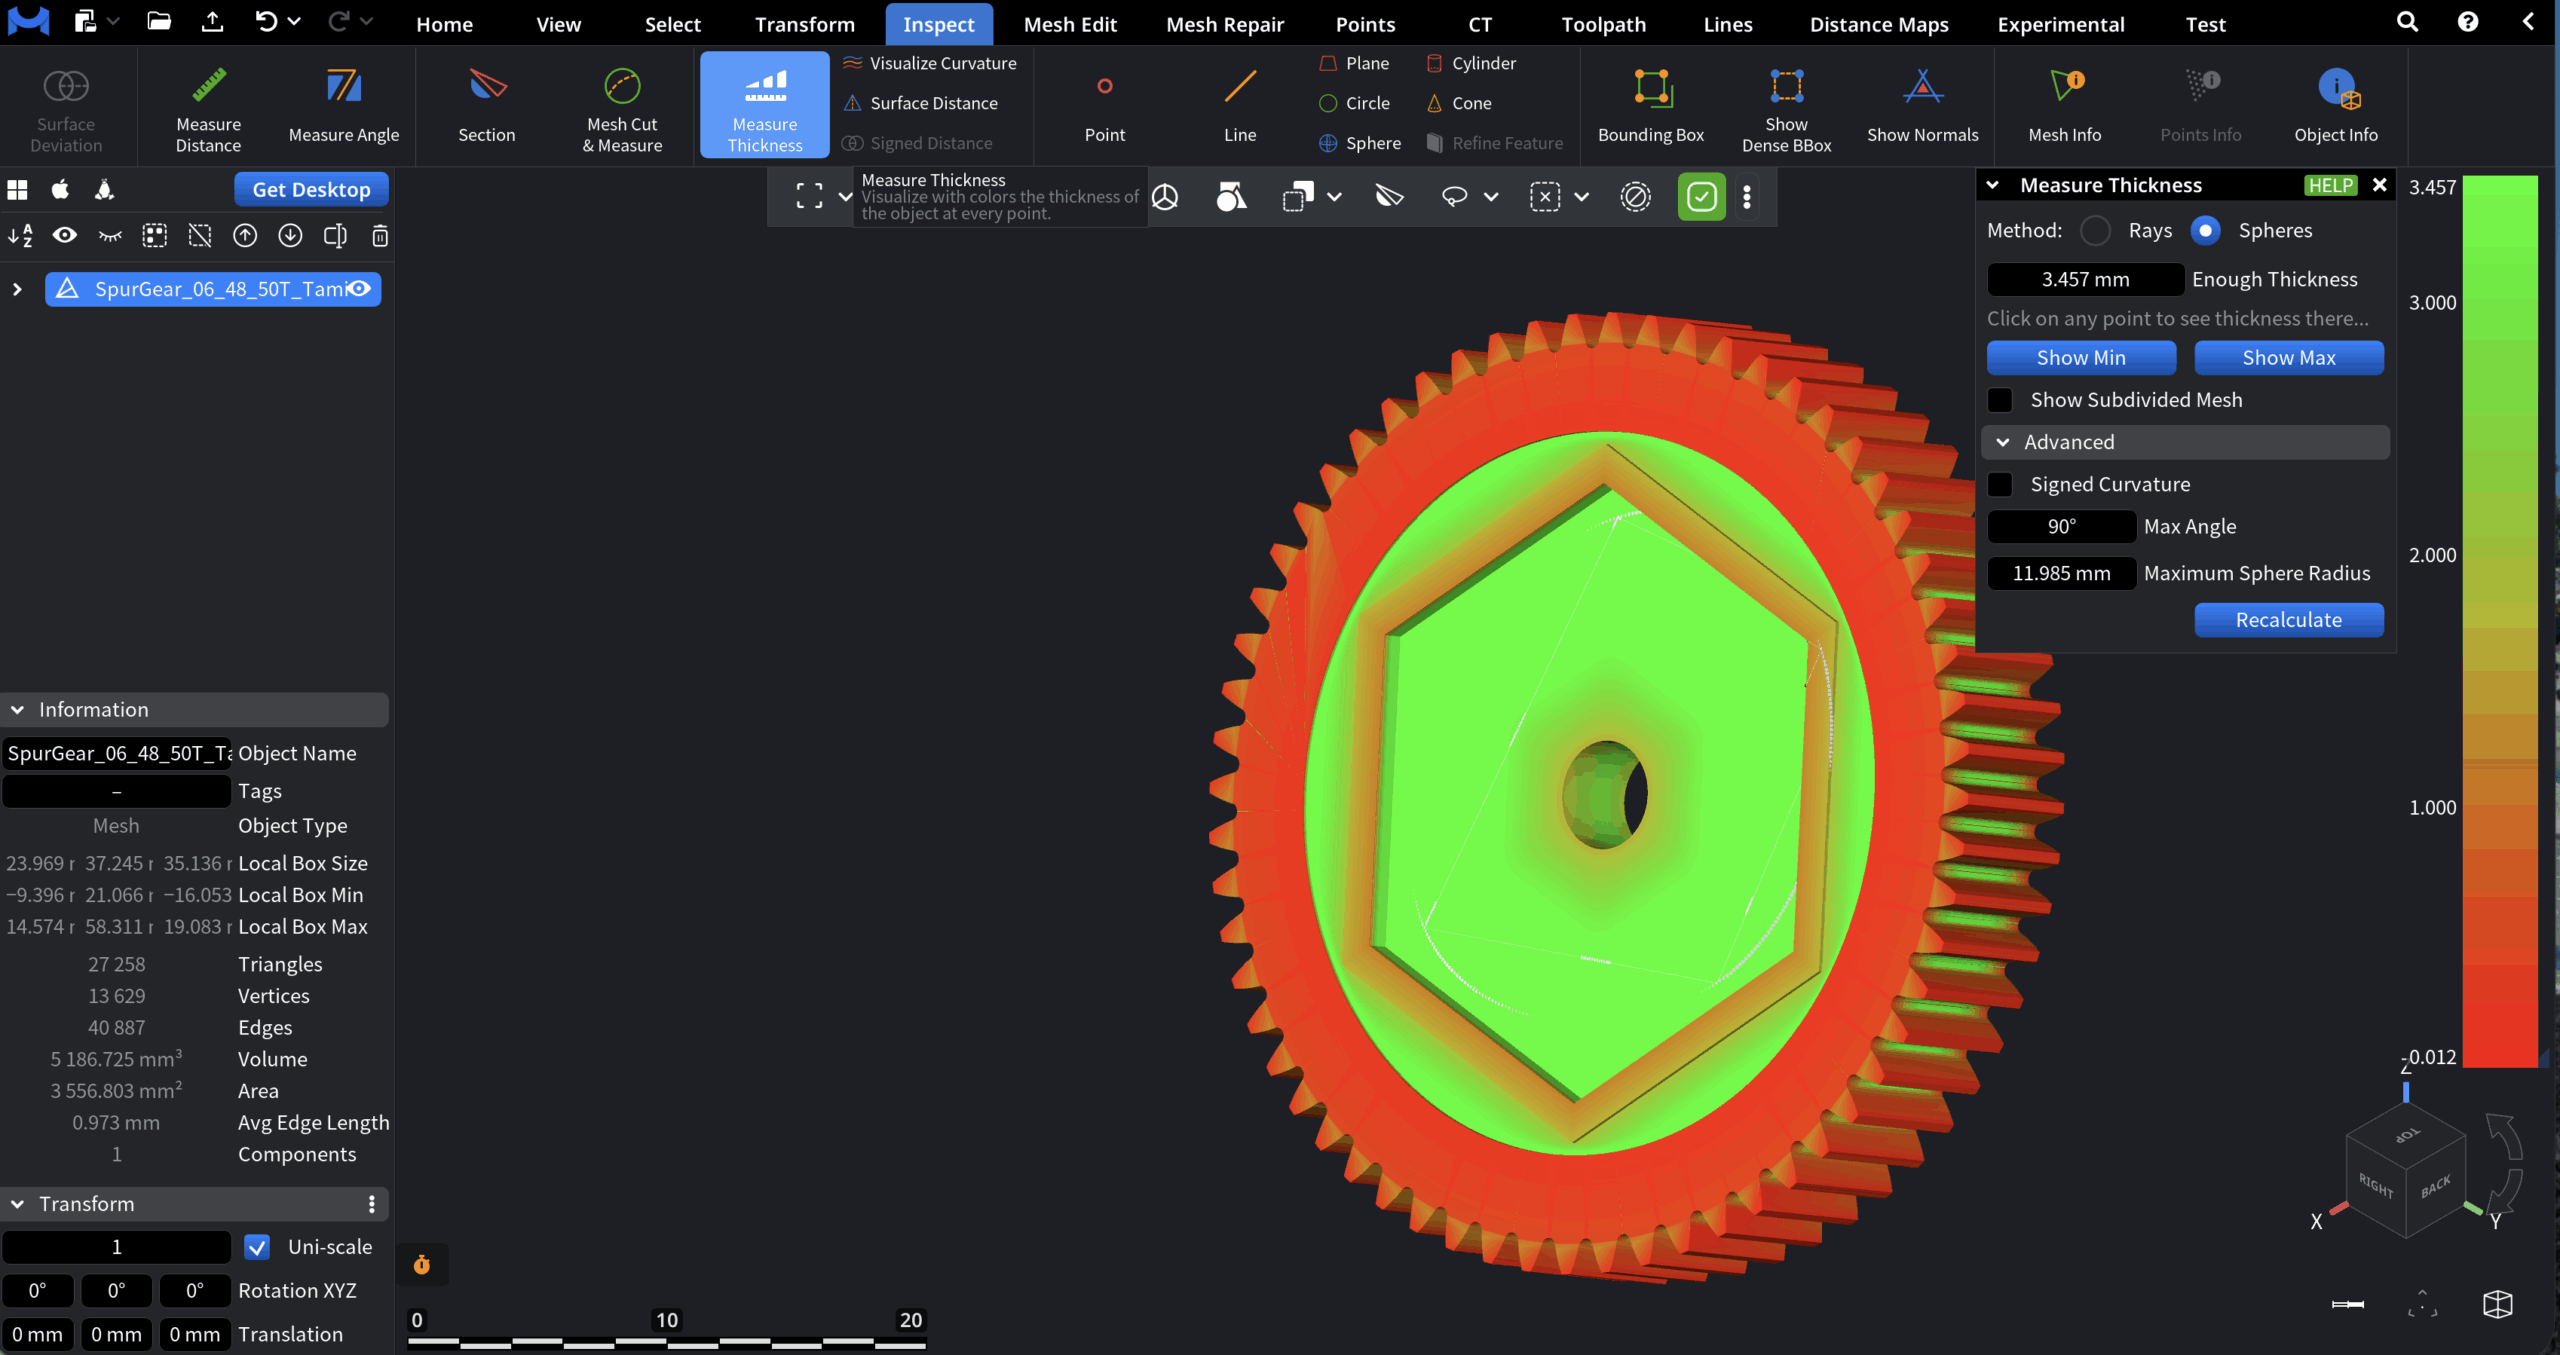
Method
Method defines the algorithm used to compute thickness values.
-
Rays calculates thickness by casting rays along surface normals and measuring the distance to the opposite side of the mesh. This method is fast and works best for relatively clean, well-oriented geometry.
-
Spheres estimates thickness using inscribed and circumscribed spheres at surface points. This method is more robust for complex shapes and curved surfaces, but may be slower.
Enough Thickness defines the threshold value used for color mapping. Areas with thickness equal to or greater than this value are displayed in green, while thinner regions are shown in yellow and red. Clicking on any point on the mesh displays the local thickness value at that location.
Visualization Controls
-
Show Min highlights the point with the minimal detected thickness on the mesh.
-
Show Max highlights the point with the maximal detected thickness on the mesh.
-
Show Subdivided Mesh subdivides the mesh internally and displays thickness values on the subdivided surface.
Advanced Settings for Spheres Method
Additional parameters available when Spheres is selected as the measurement method.
-
Signed Curvature displays curvature values computed from the inverse radius of the maximal sphere touching the surface at each point.
-
Max Angle sets the maximum allowed angle between the search direction and the direction from the sphere’s center to the detected surface point.
-
Maximum Sphere Radius limits the maximum allowed radius of the probing sphere. This parameter should usually be changed only if automatic detection fails.
Recalculate recomputes thickness values using the current advanced settings.
Visualize Curvature
The Visualize Curvature tool analyzes surface curvature and displays it directly on the mesh using a color map.
It helps identify convex and concave regions, sharp transitions, surface smoothness, and geometric anomalies.
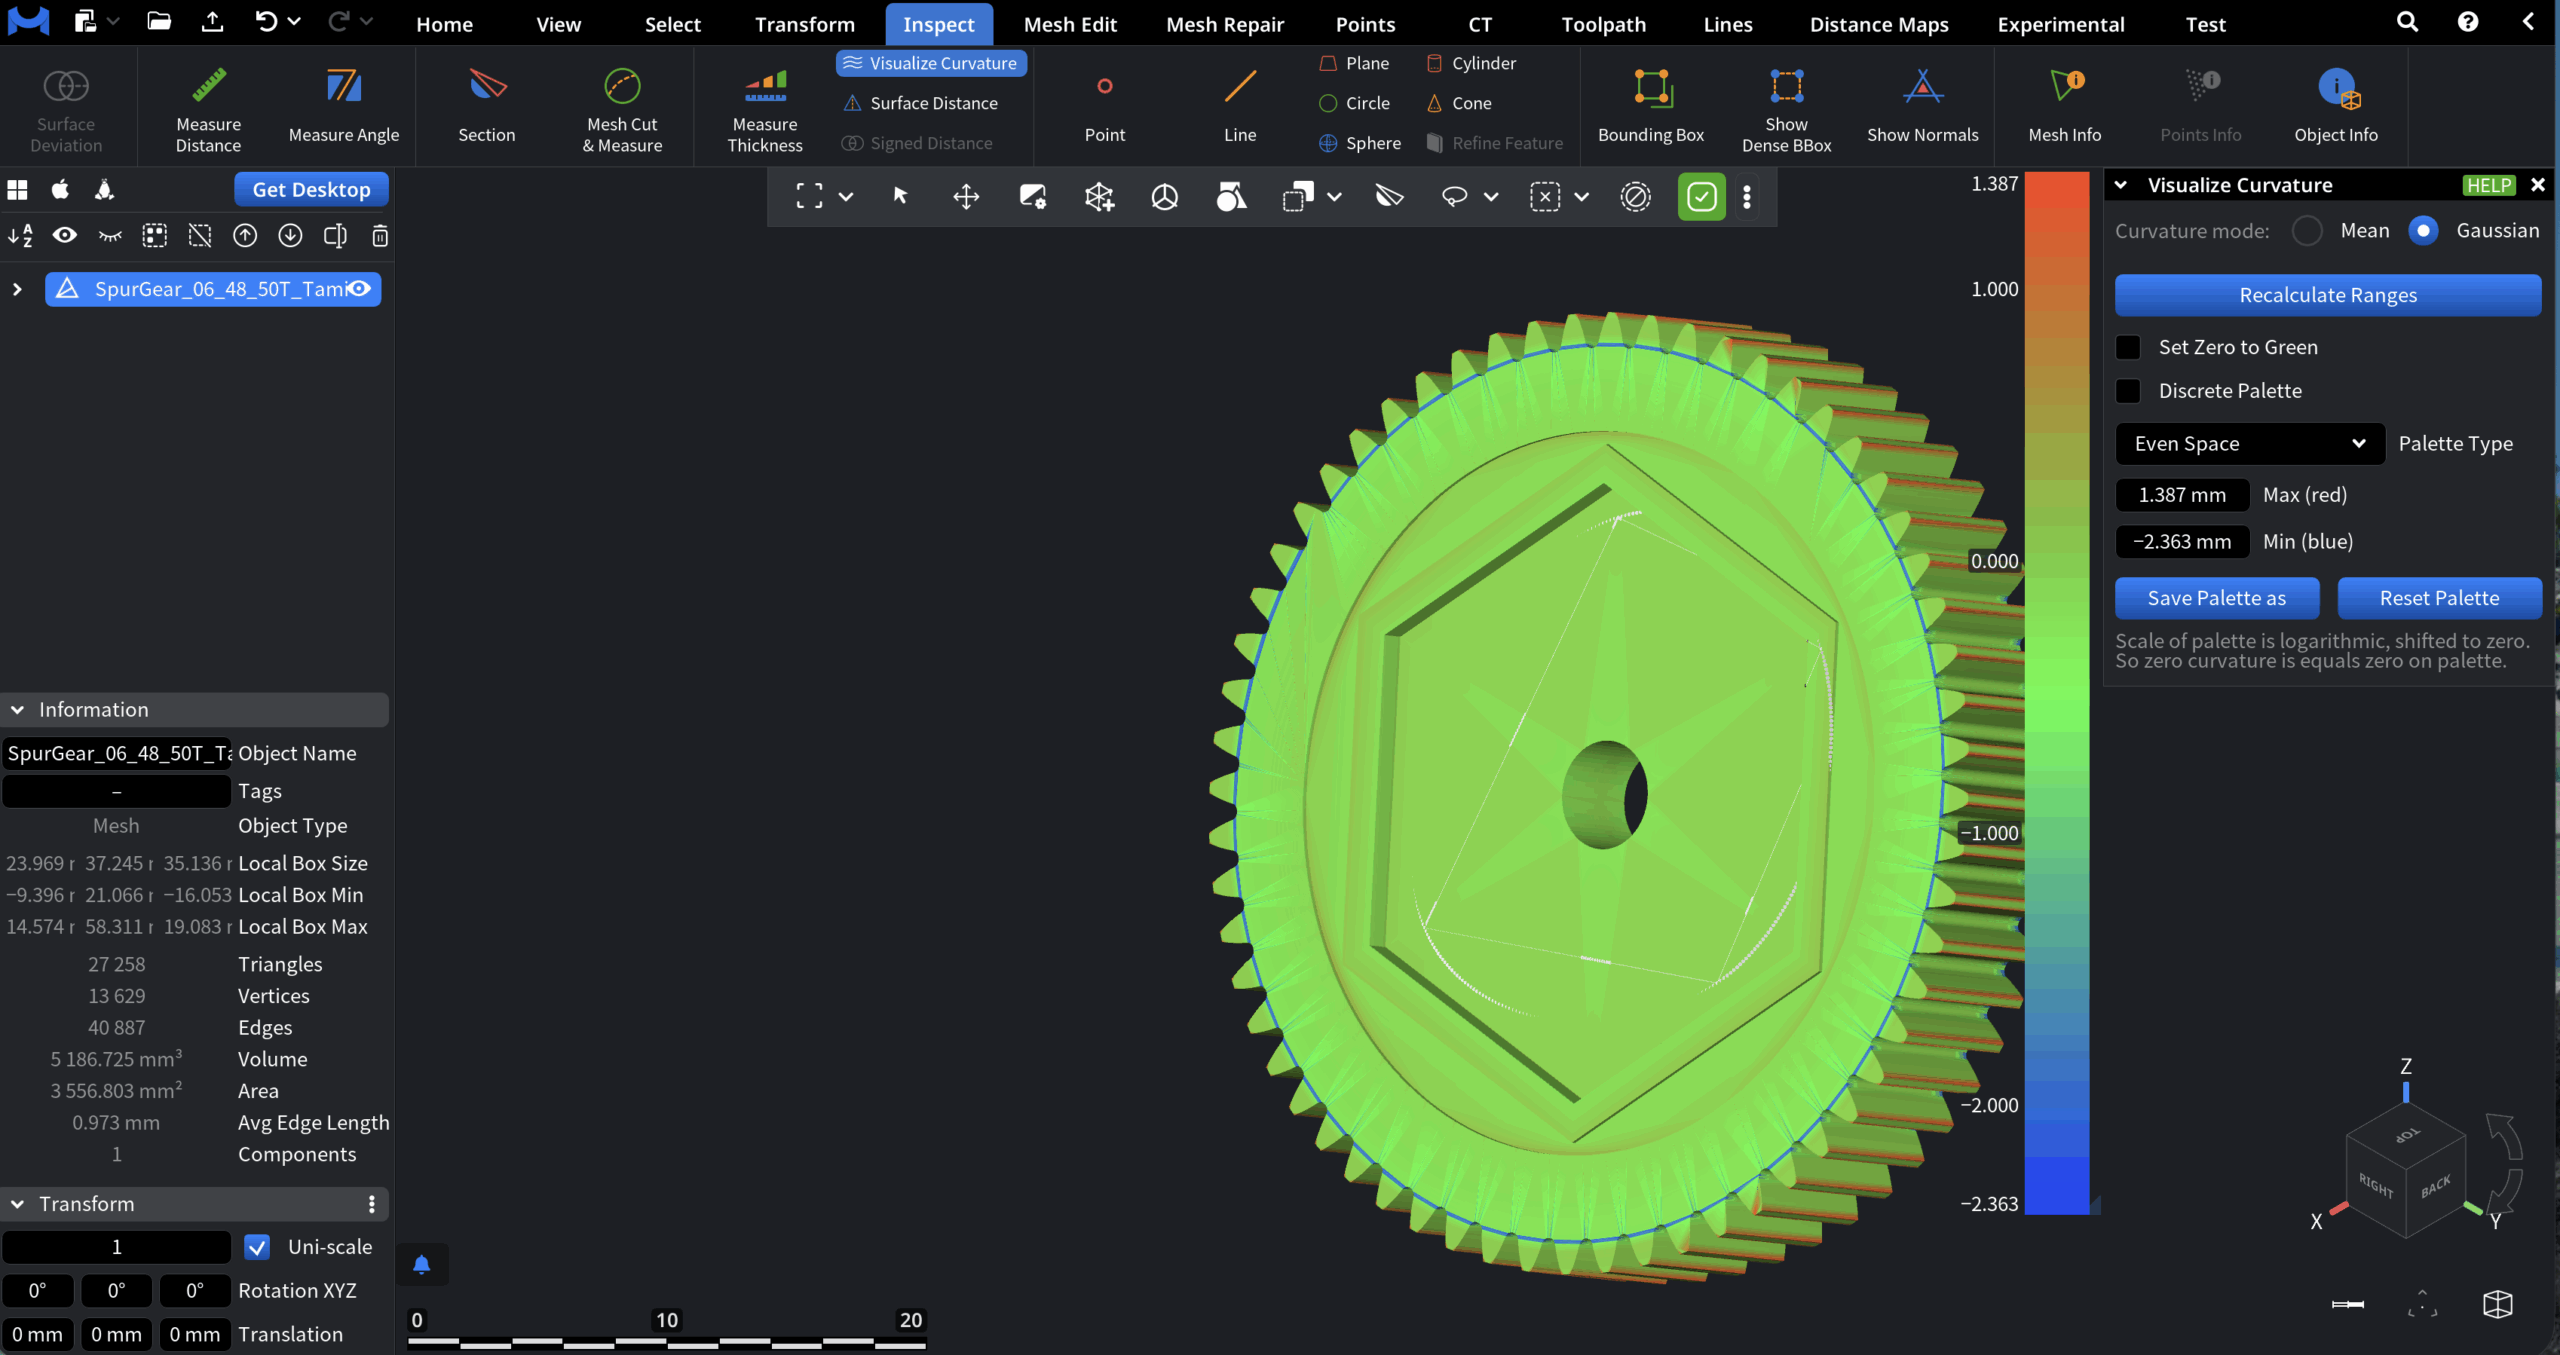
Curvature Mode
Defines the type of curvature to visualize.
-
Mean displays mean curvature, which represents the average of principal curvatures at each surface point. As such, it is useful for identifying smoothness, gradual shape changes, and overall surface fairness.
-
Gaussian displays Gaussian curvature, computed as the product of the principal curvatures. This mode highlights fundamental surface properties, such as saddle regions, peaks, and pits.
Palette and Range Controls
-
Recalculate ranges automatically recalculates curvature value limits.
-
Set Zero to Green forces zero curvature values to be displayed in green, making flat regions easier to identify.
-
Discrete Palette. When it is enabled, the color map is divided into a fixed number of discrete levels instead of a smooth gradient. This is useful for classification and threshold-based analysis.
-
Palette Type defines how curvature values are distributed across the color map:
-
Even Space distributes colors evenly across the full curvature range.
-
Central Zone prioritizes resolution around zero curvature, allowing positive and negative deviations to be visualized more clearly.
-
-
Max (red) / Min (blue) displays the current maximum and minimum curvature values mapped to the color scale.
Palette Management
-
Save Palette as saves the current palette configuration as a preset that can be reused later.
-
Reset Palette restores the palette to its default settings.
Surface Distance
Surface Distance visualizes the shortest distance measured along the mesh surface from a specified source to every other point on the mesh.
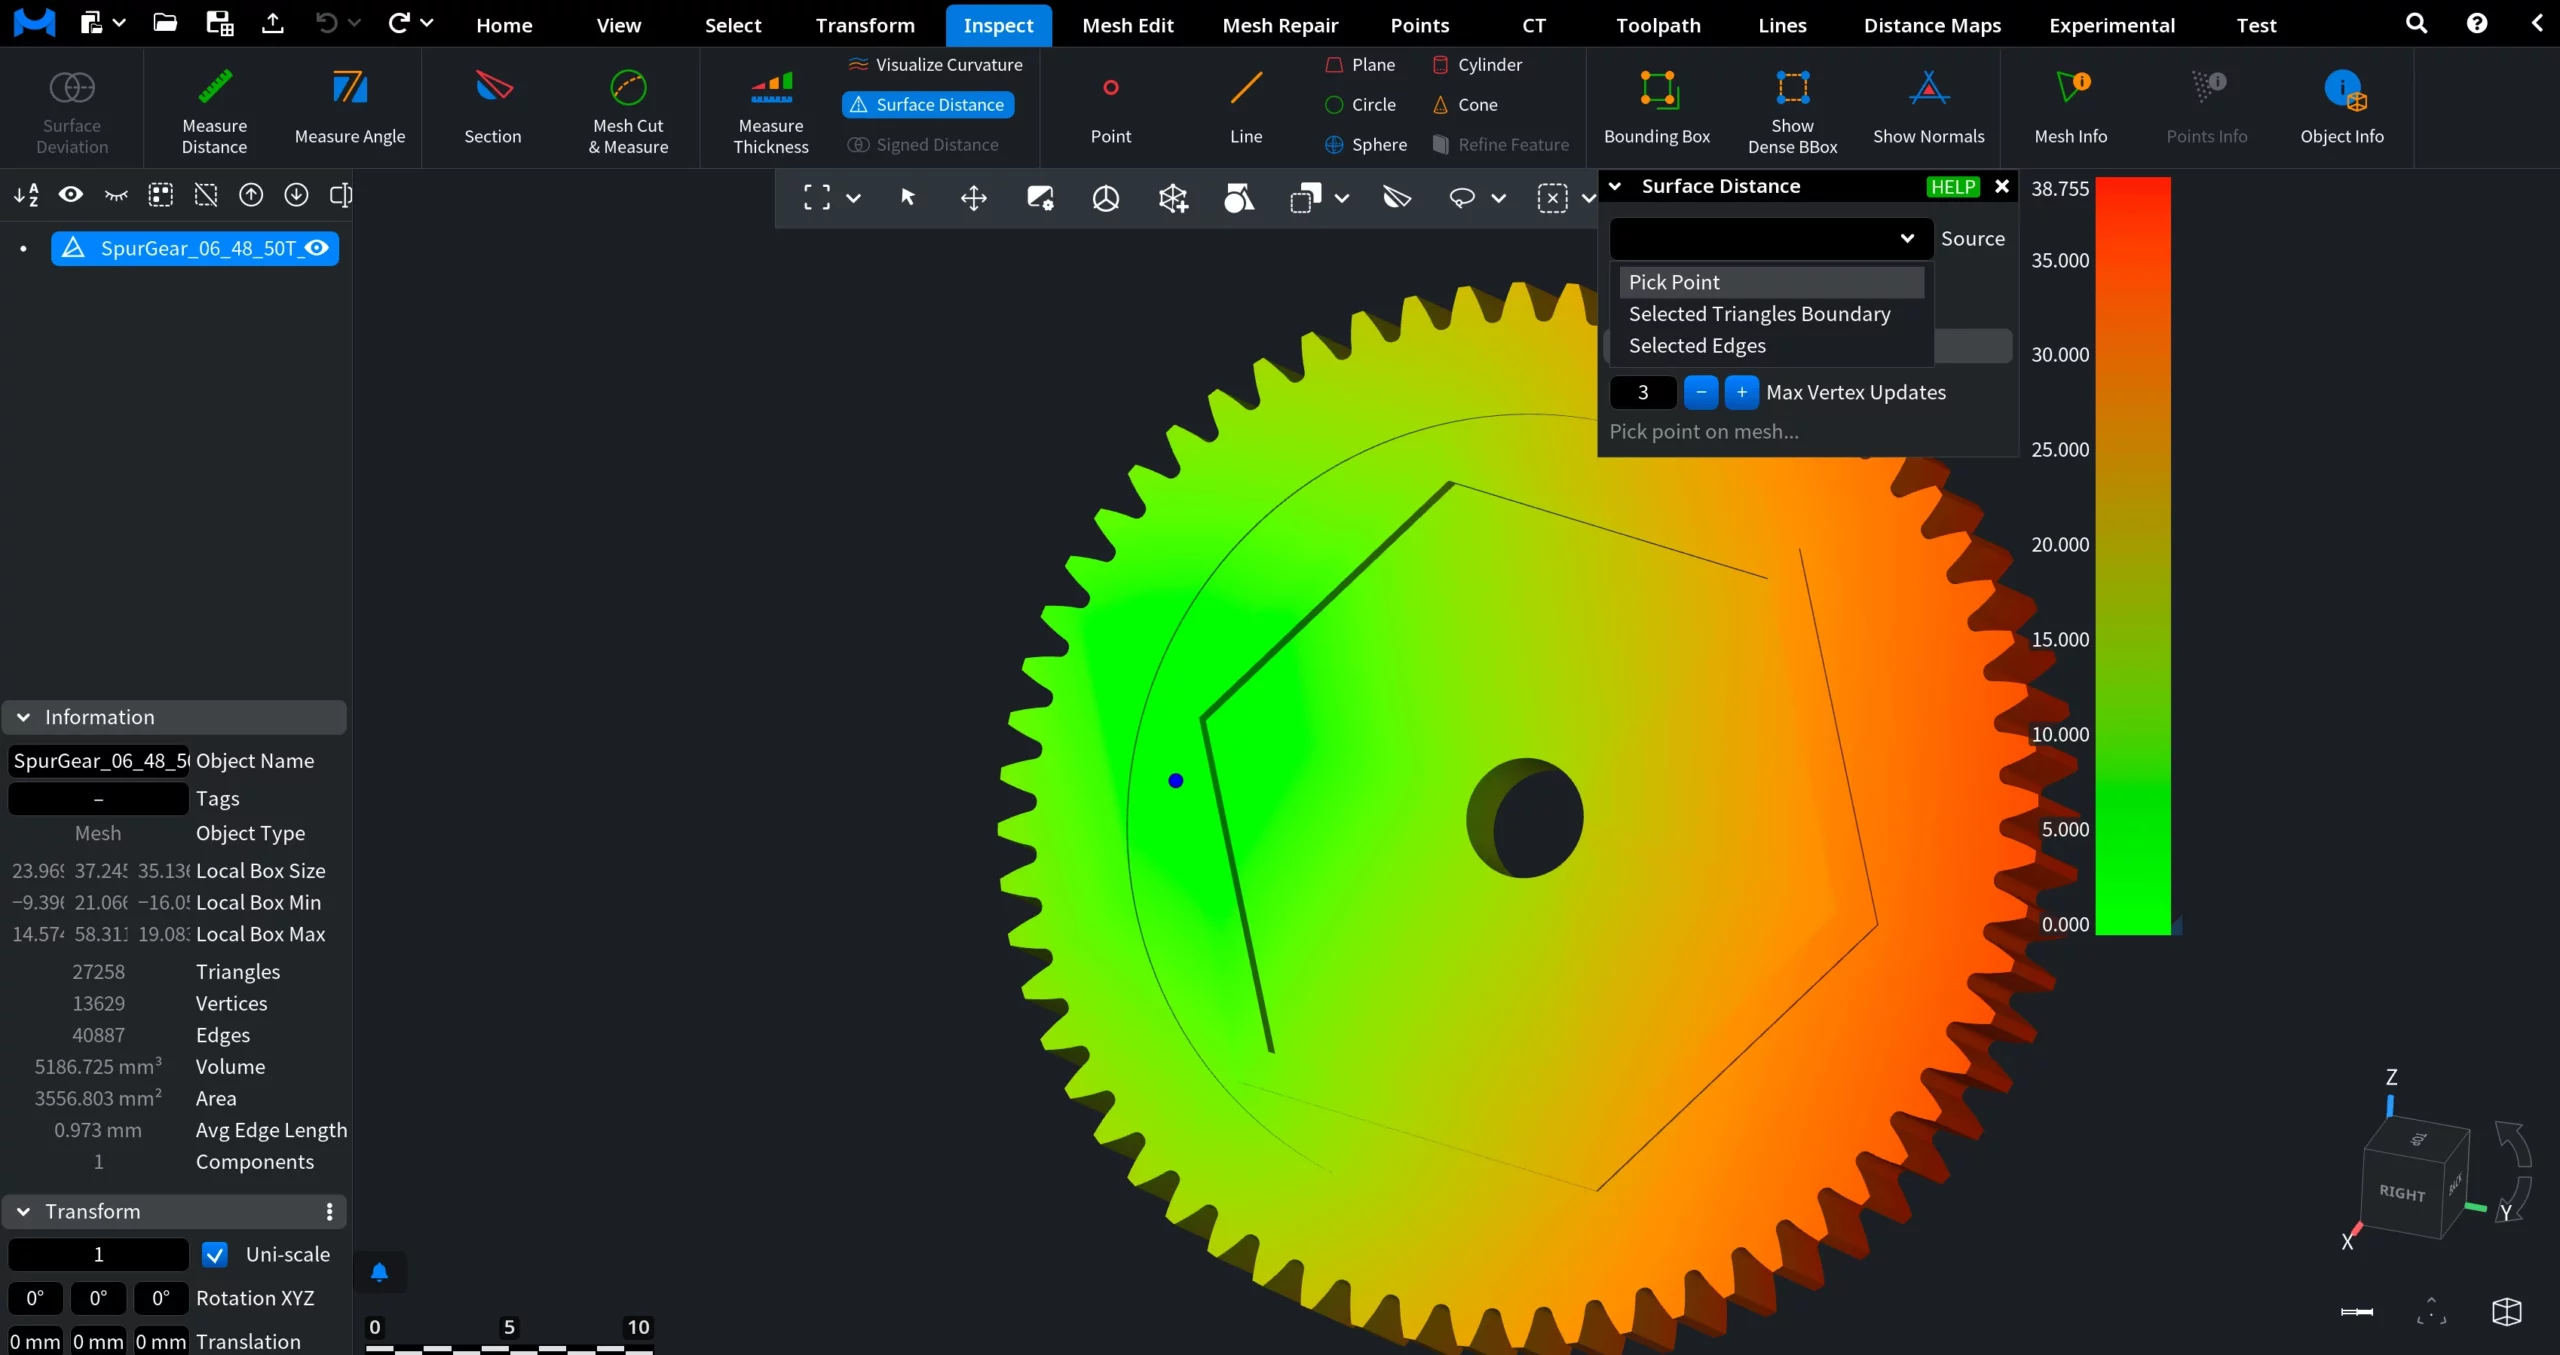
Sources for Surface Distance
The Source setting defines where the surface distance computation starts. Available options determine how the initial distance values are seeded.
-
Pick Point uses a single user-selected point on the mesh as the source.
-
Selected Triangles Boundary uses the boundary of the currently selected triangle-based region as the source.
-
Selected Edges uses selected edges as the source.
Pick Point
When Pick Point is selected, Surface Distance computes geodesic distances starting from a single user-defined point on the mesh surface.
Iso-lines controls whether distance contour lines are displayed on the surface.
-
No does not draw any distance iso-lines. Only the color gradient is used to visualize surface distance.
-
One draws a single iso-line at a specified distance value. Useful for highlighting an exact distance threshold on the surface.
-
Many draws multiple evenly spaced iso-lines across the surface. Useful for visualizing distance distribution and gradients.
Iso-value (available when Iso-lines = One) defines the exact surface distance value at which a single iso-line is drawn. When Iso-value is set, you can click on Cut & Select to cut the mesh along the line and select the region inside.
Number of Iso-lines (available when Iso-lines = Many) specifies how many distance iso-lines are drawn on the surface.
Advanced
Additional controls affecting how distances are propagated over the mesh.
-
Max Vertex Updates sets the maximum number of times a vertex distance value can be updated during computation.
Selected Triangles Boundary
When Selected Triangles Boundary is selected as the source, Surface Distance computes geodesic distances starting from the boundary of a selected triangle region, rather than from a single point. All other controls in the panel work identically to Pick Point.
Selected Edges
When Selected Edges is selected as the source, Surface Distance computes geodesic distances starting from the currently selected edges. All other controls in the Surface Distance panel work identically to Pick Point.
Signed Distance
Signed Distance measures the minimum distance between two objects while also indicating which side of the reference surface the measured points lie on. As a result, Signed Distance always operates on two objects: a reference object and a measured object.
Unlike standard distance measurements, Signed Distance assigns a sign to each distance value:
-
Positive values indicate points located outside the reference object
-
Negative values indicate points located inside the reference object
-
Zero indicates direct contact or intersection.
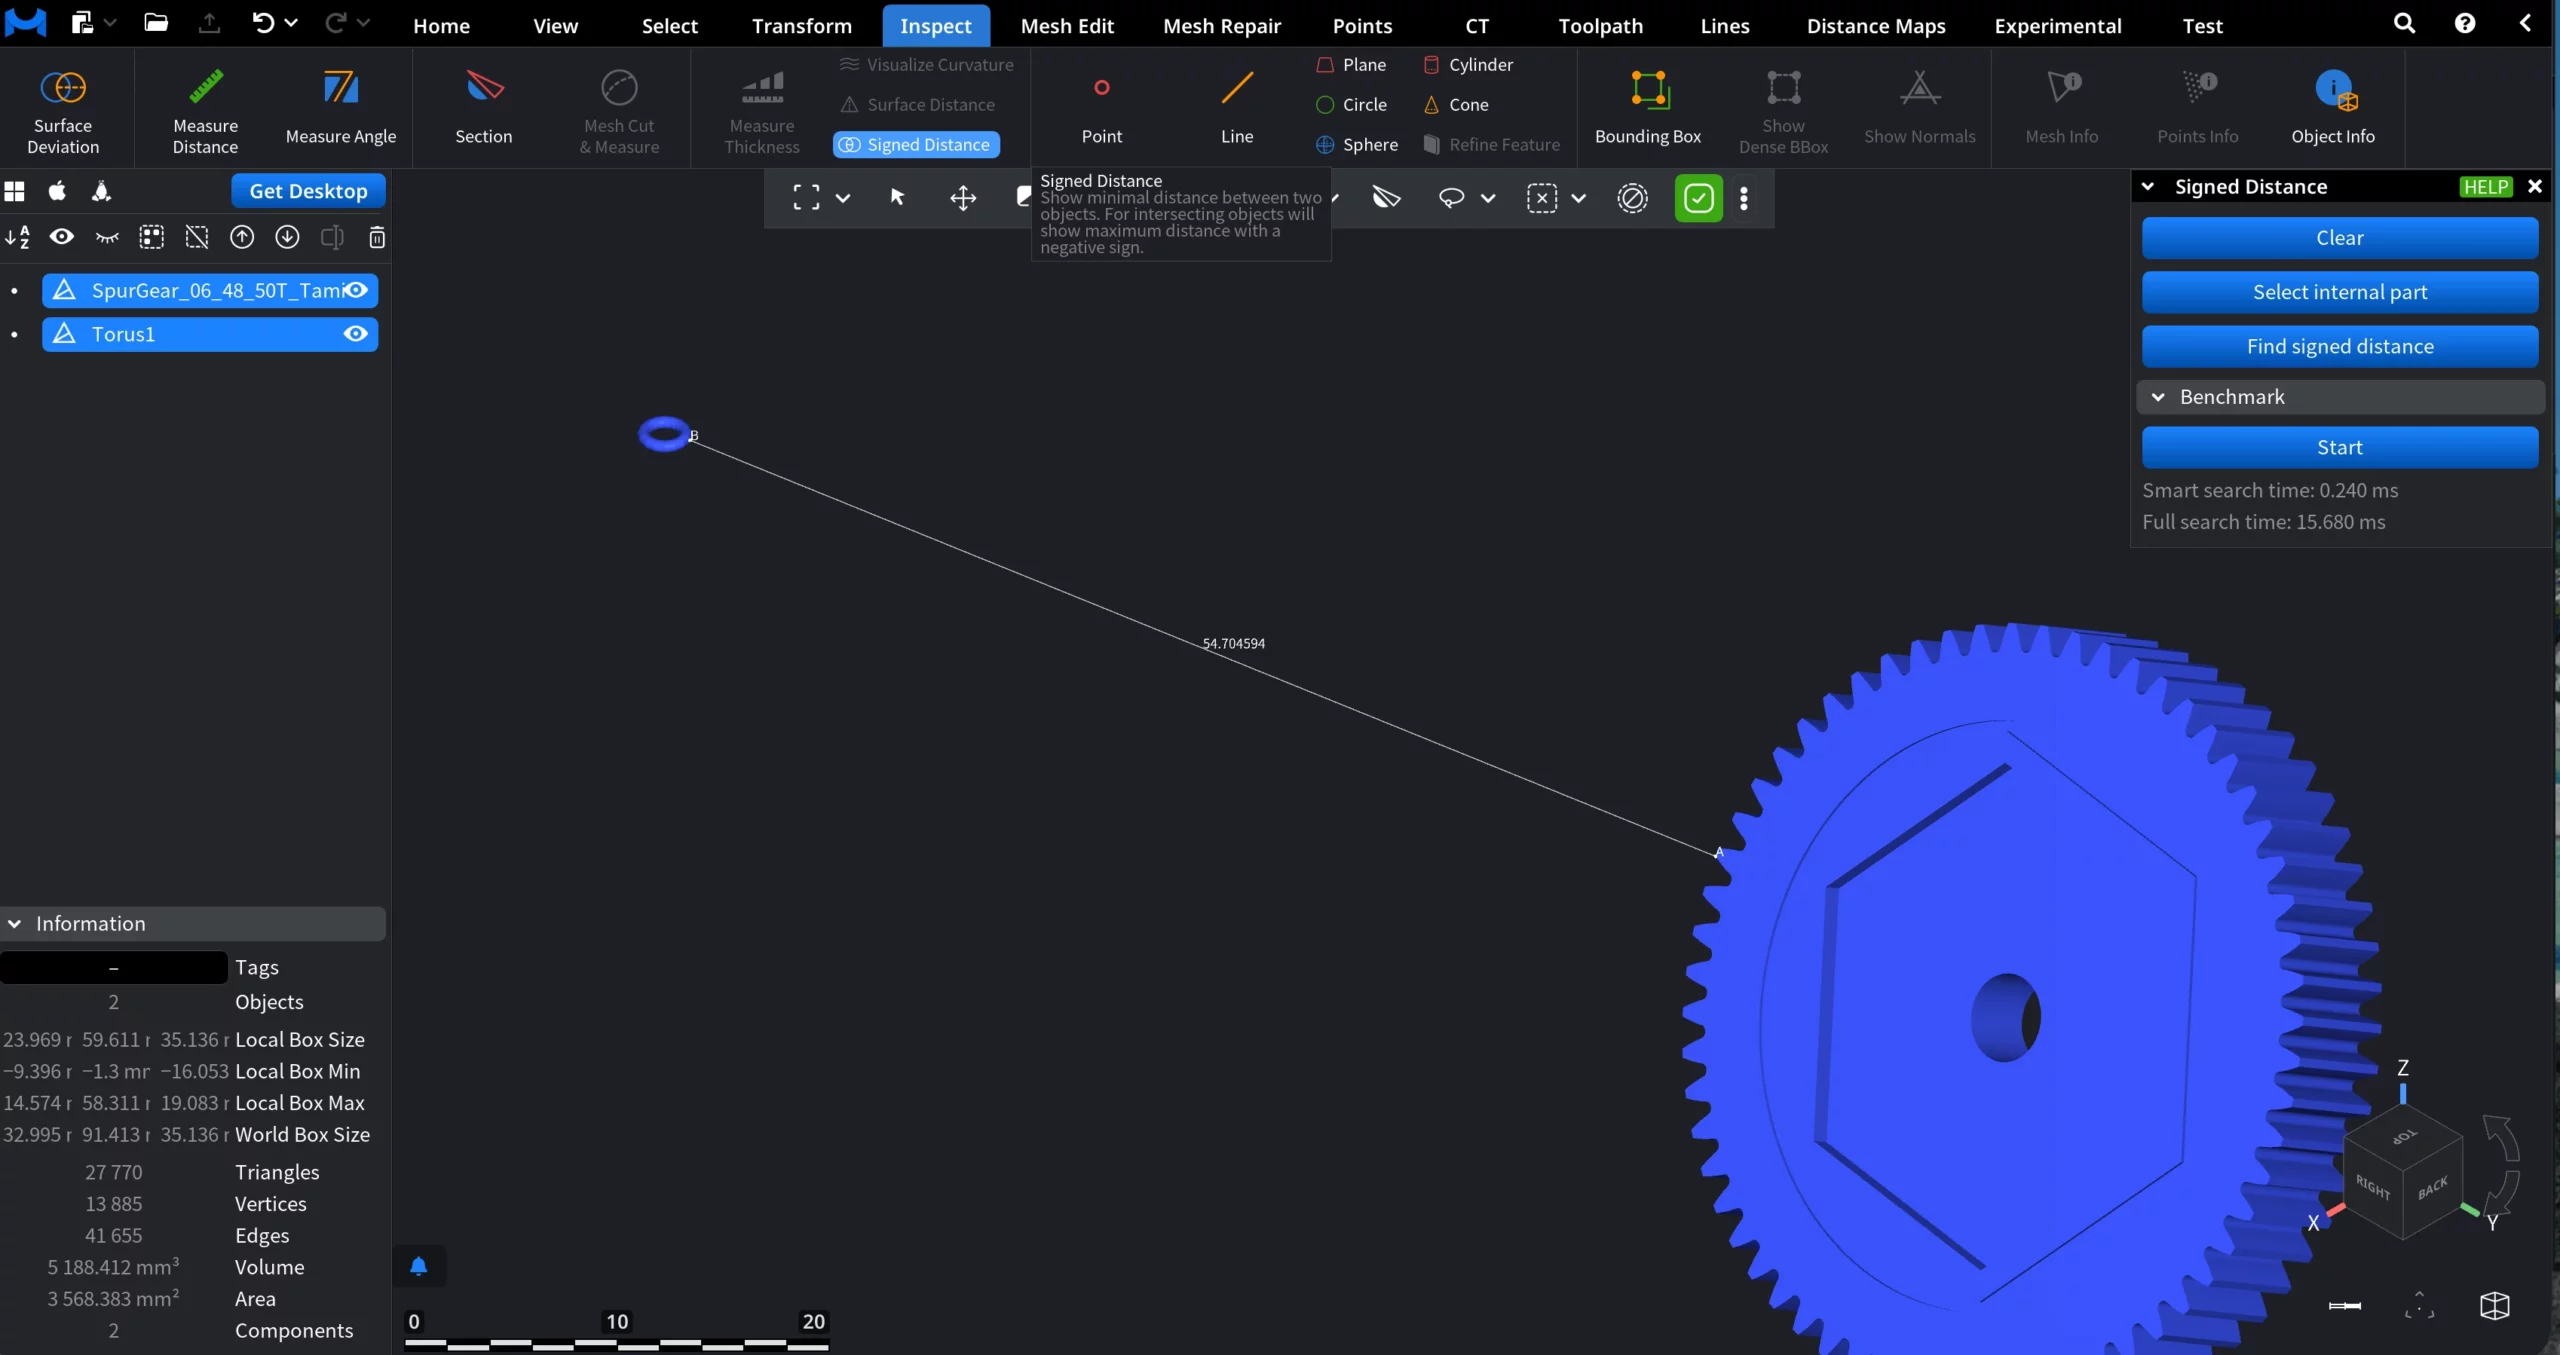
Benchmark
The Benchmark section reports performance metrics for the signed distance computation:
-
Smart search time is the time spent in the optimized distance search
-
Full search time is the time required for the exhaustive distance computation
These values help assess performance when working with complex meshes or large assemblies.
Point
Clicking on Point allows users to create a point feature object based on the selected objects' geometry. Points, as well as other features, can be picked on meshes, point clouds, or surfaces of other features. Several options are available in the corresponding Point tab.
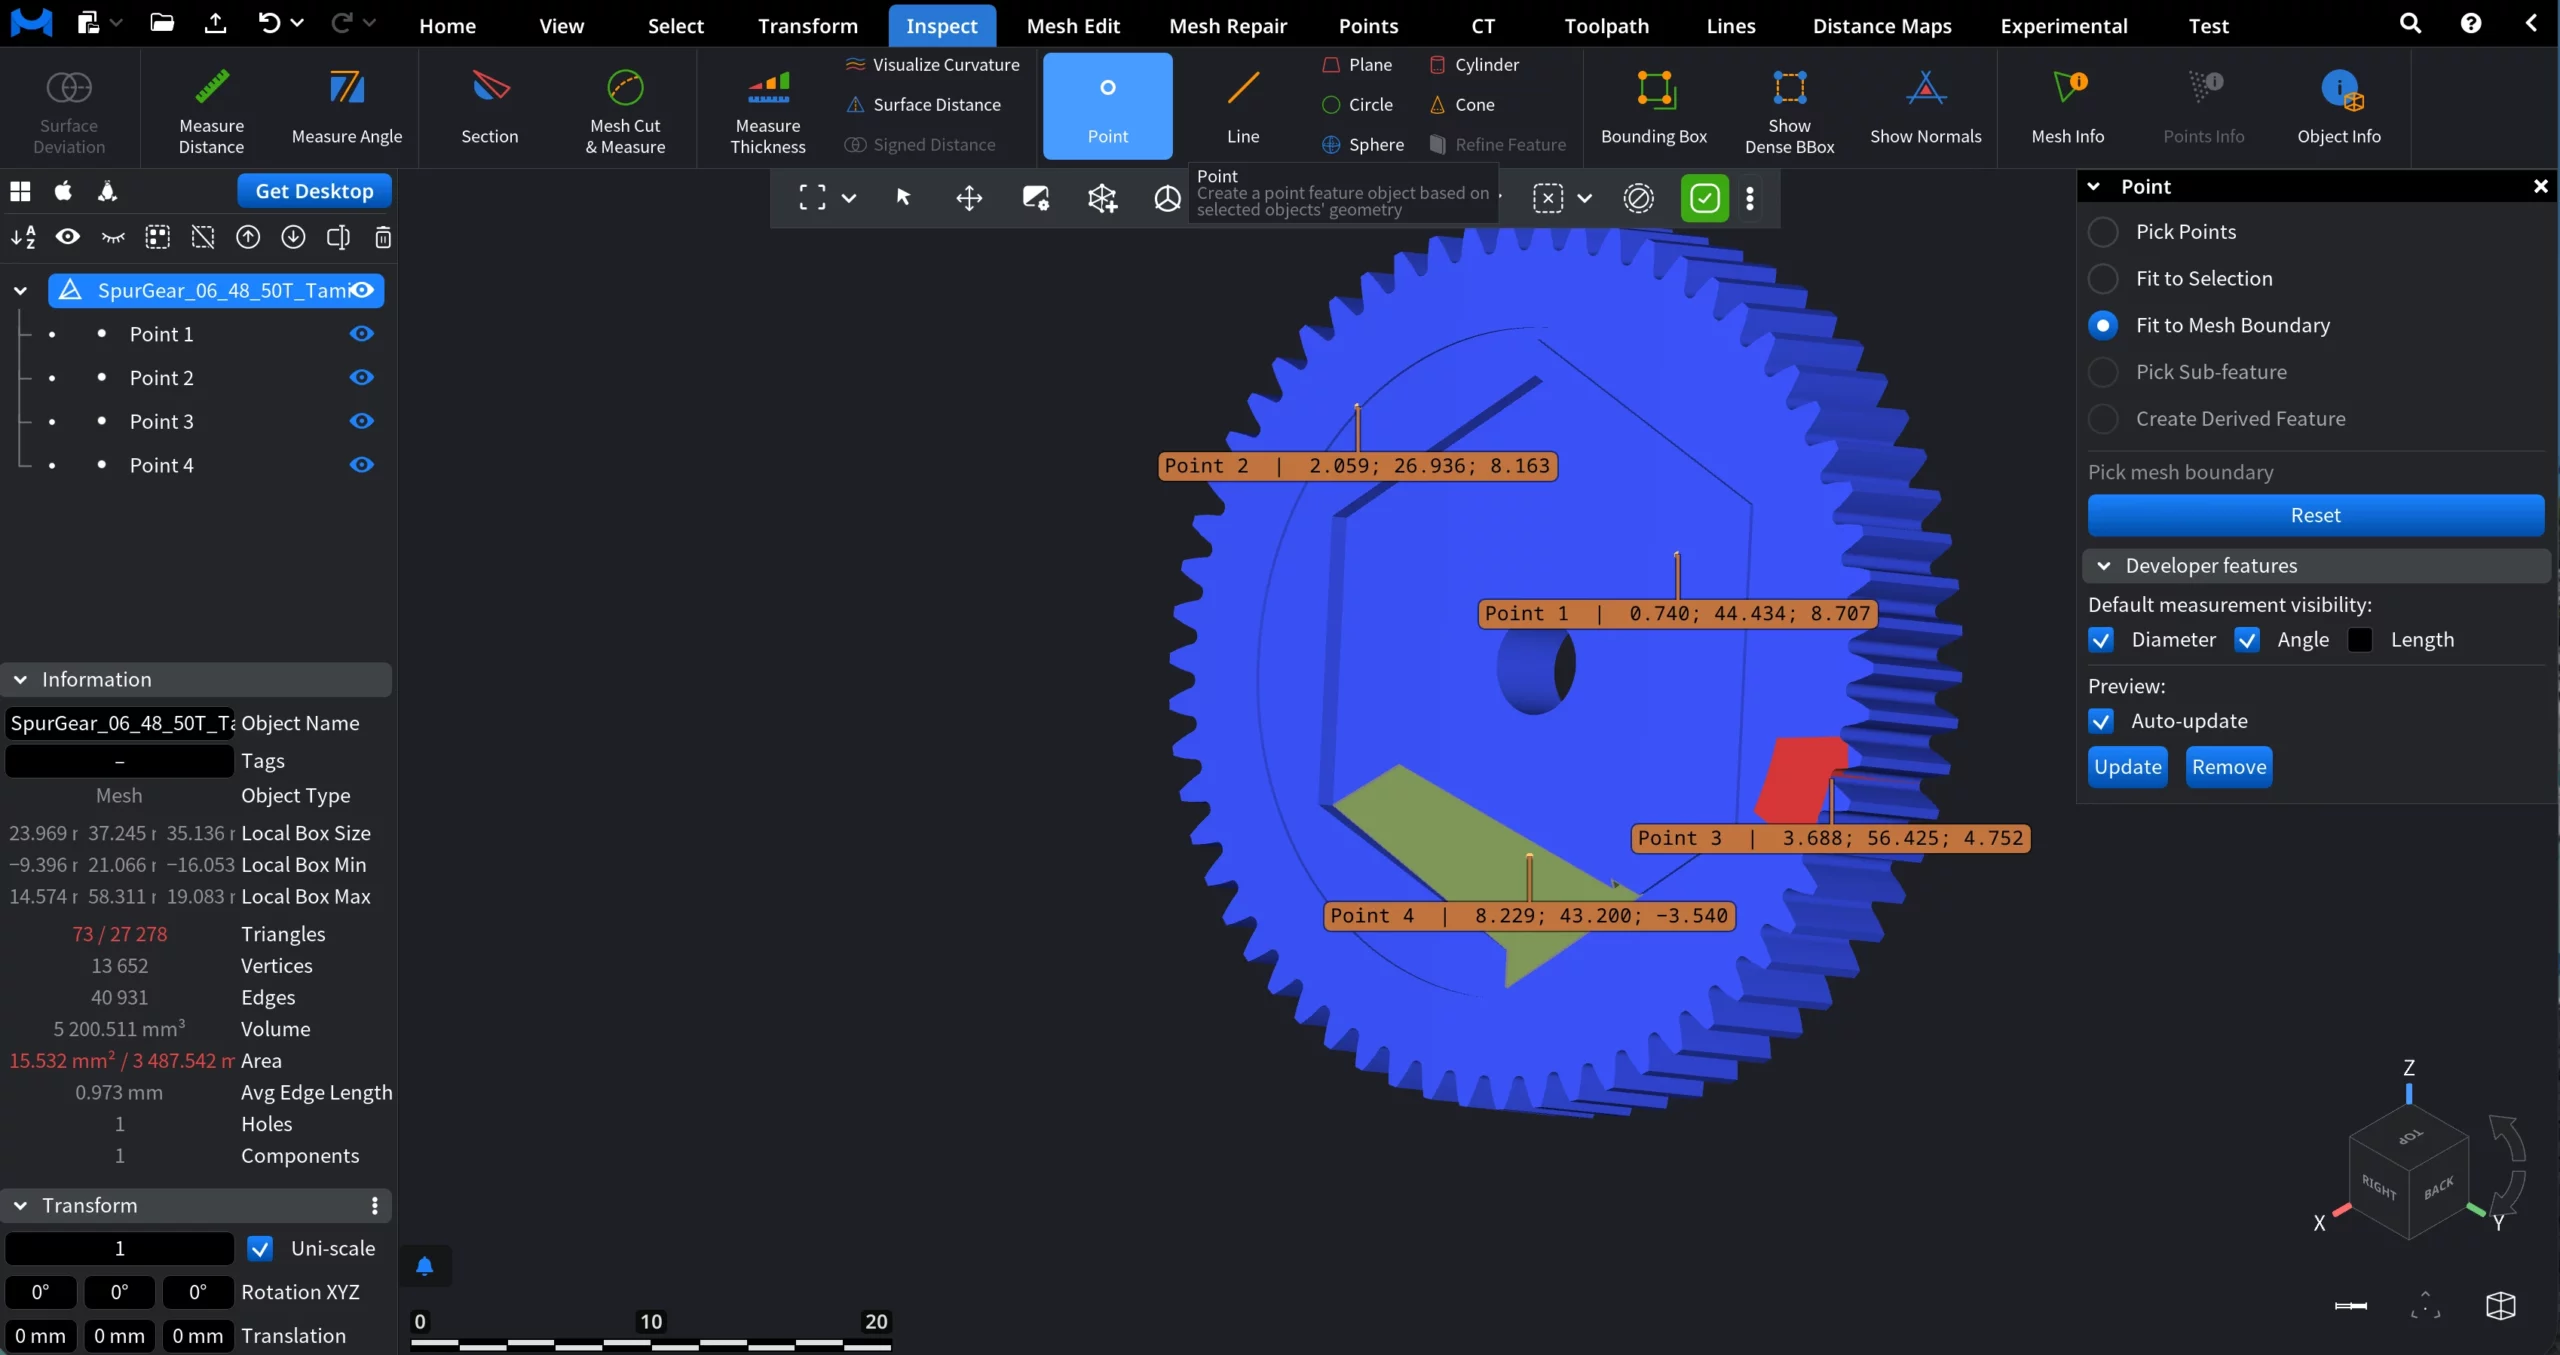
Pick Points enables interactive point placement directly in the viewport.
-
Click on the mesh or surface to place a point. Then click New Feature to finalize the process.
-
Created points are displayed in the scene tree and can be selected, hidden, or removed.
-
Points can be dragged after creation to adjust their position.
-
Hold Option while clicking to snap points to mesh edges.
-
Hold Shift and click a point to remove it.
Fit to Selection creates a point automatically by fitting it to the currently selected primitives (point 6 in the screenshot below).
-
Use one of the selection tools (Lasso, Rect, Polygon, Brush, or Pick) to select mesh primitives.
-
The point is positioned based on all vertices contained within the selected area.
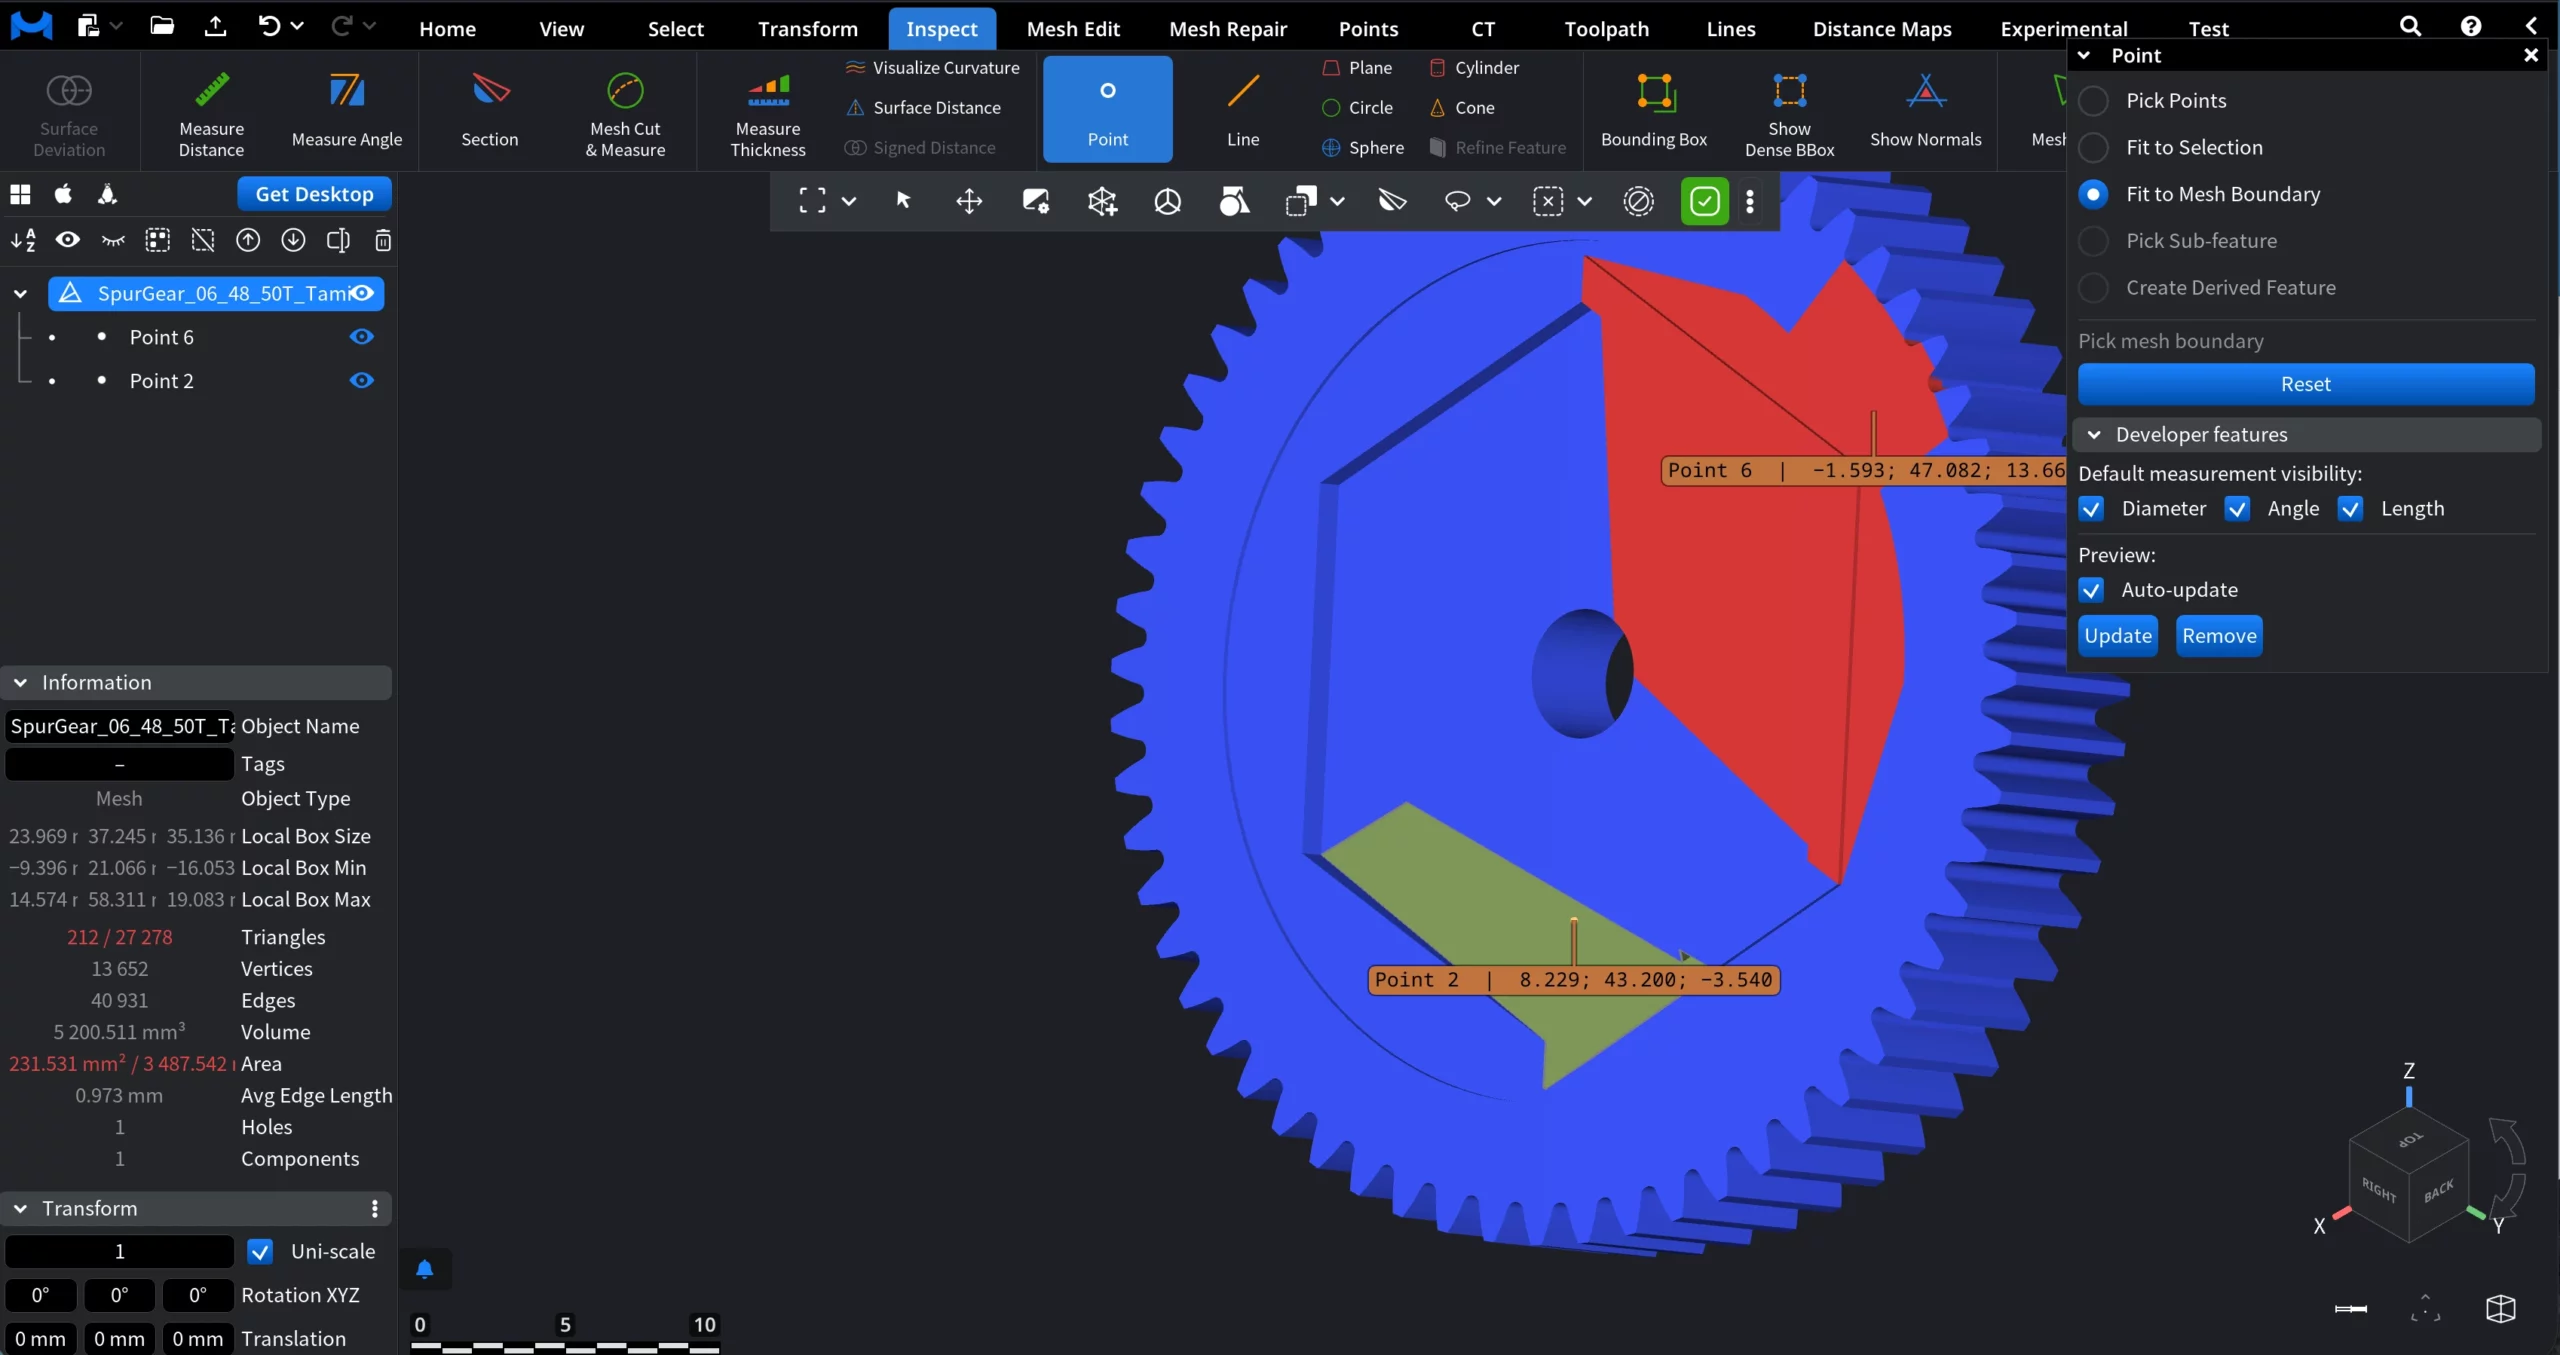
Fit to Mesh Boundary places a point based on the boundary of the selected mesh region. This option becomes available only when a valid boundary exists, such as in the screenshot above after cutting the mesh (Point 2).
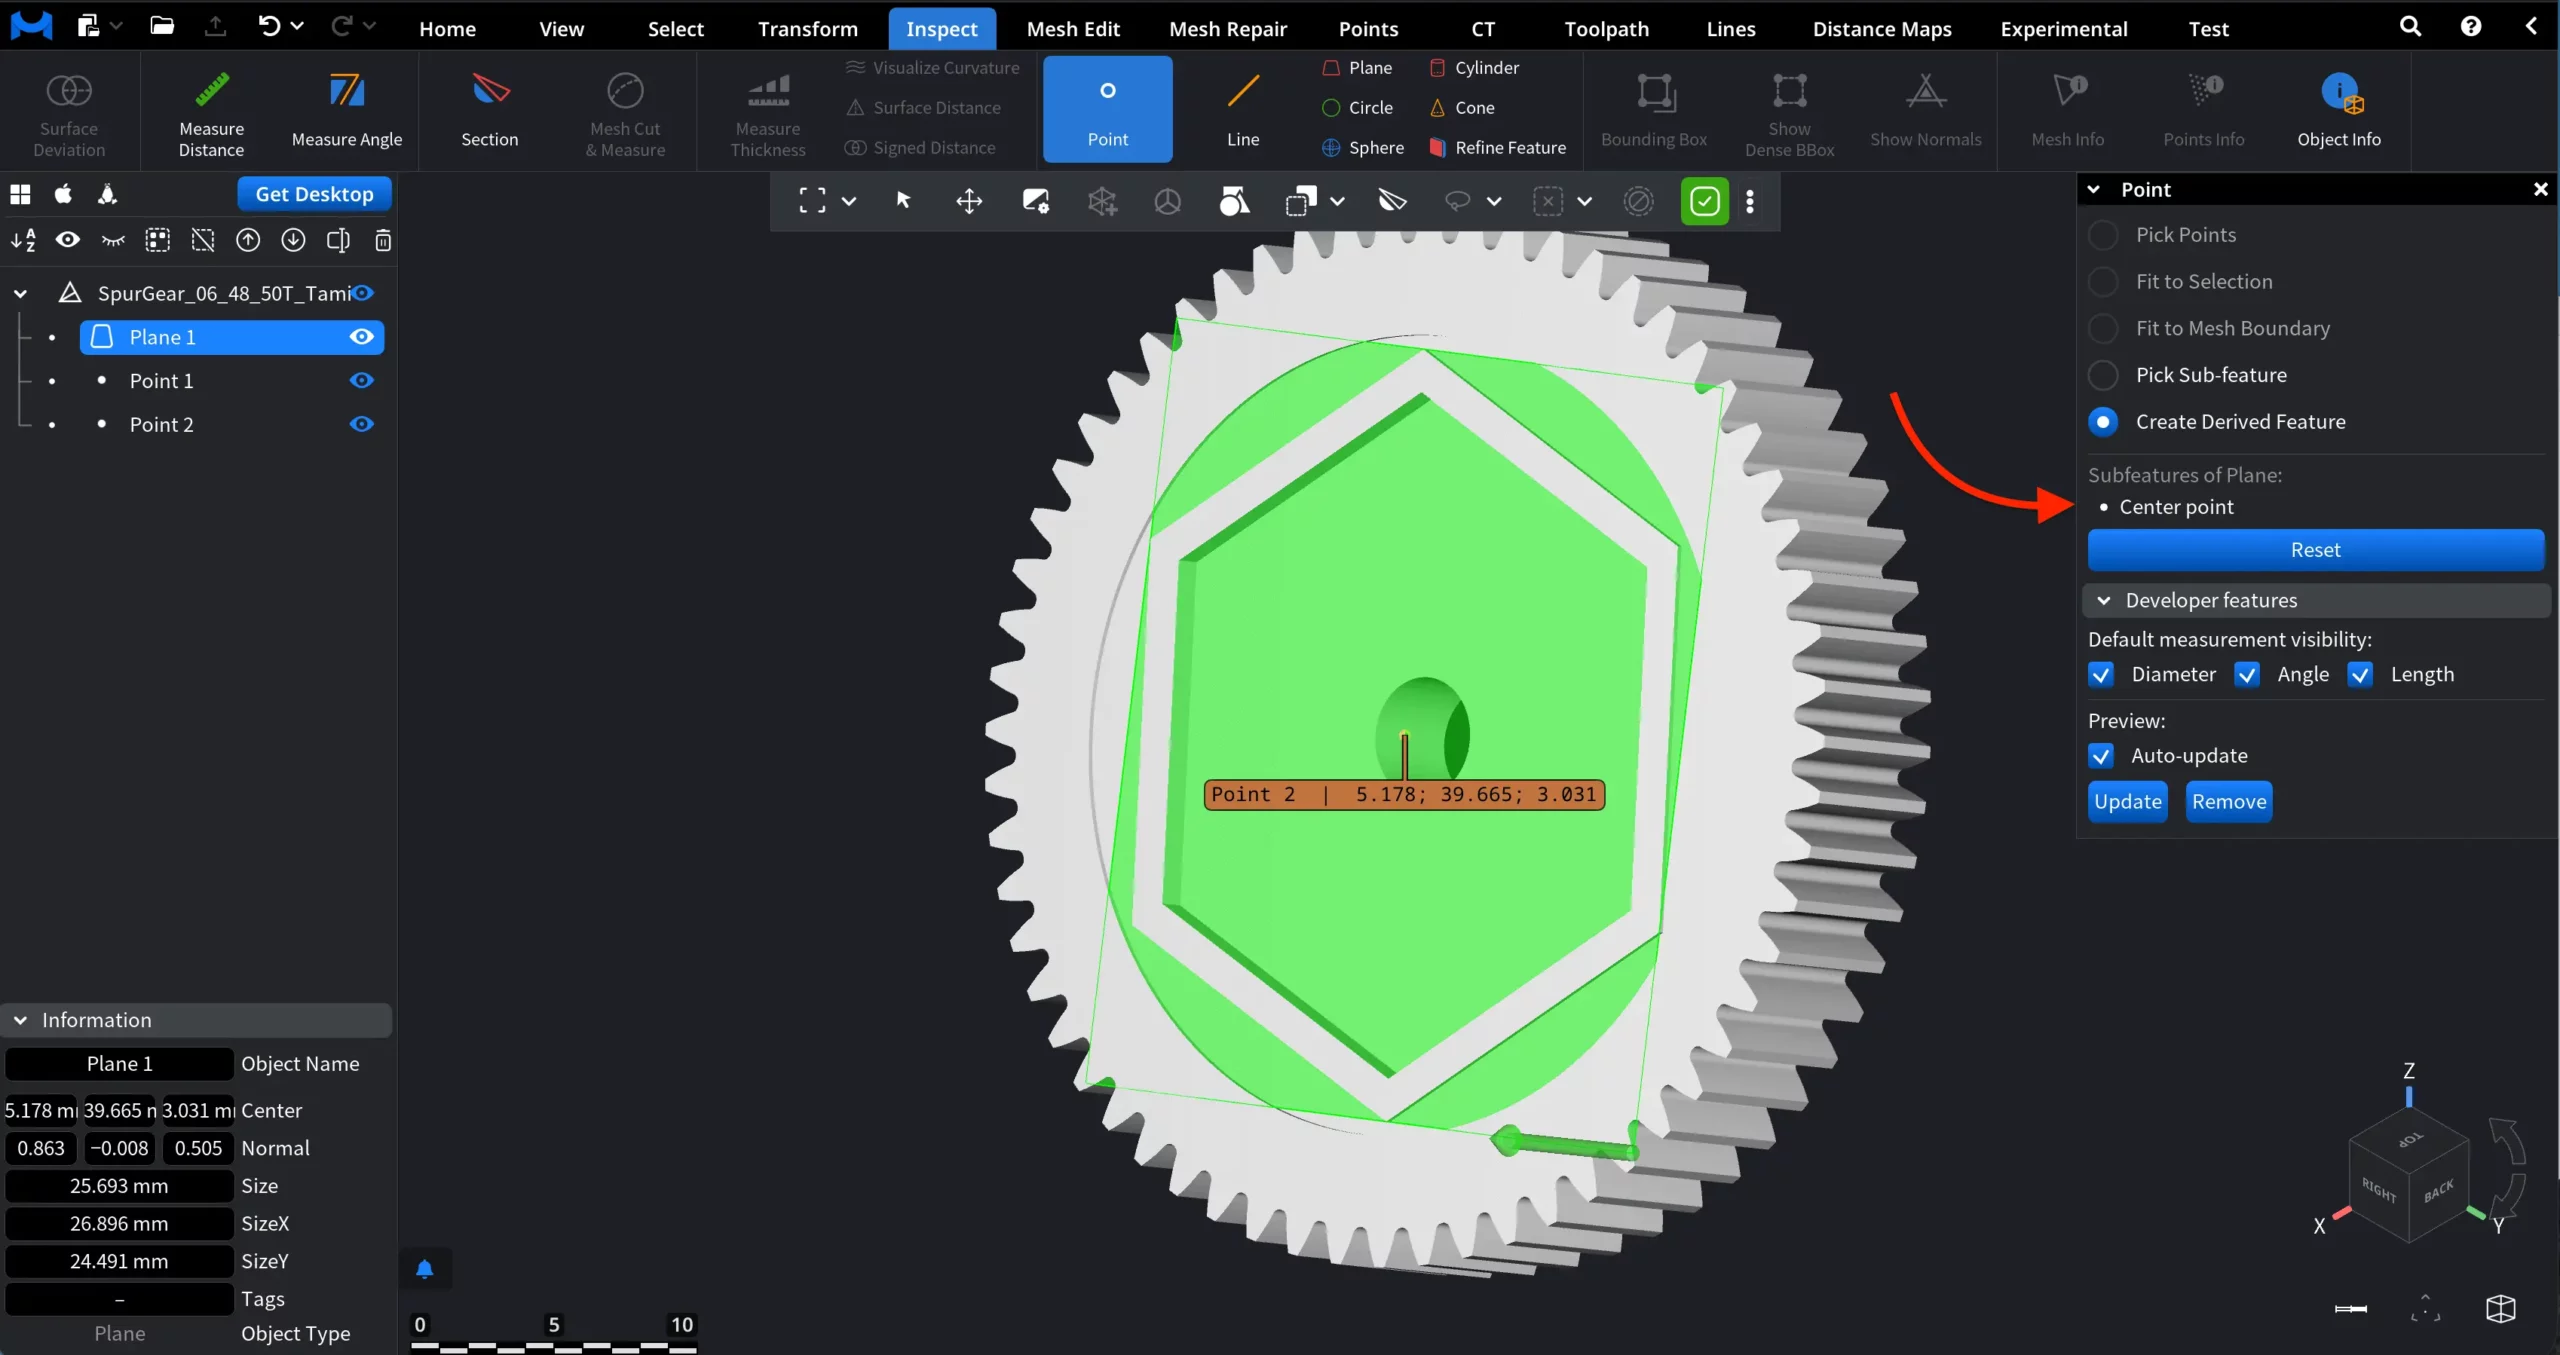
Pick Sub-feature creates a point by extracting geometry from an existing feature, not from raw mesh data.
Create Derived Feature creates a new point feature whose definition depends on other existing features.
In a similar fashion, you can create the following features, on top of Points:
- Lines
- Planes
- Circles
- Spheres
- Cylinders
- Cones
The approach here is identical to Points. However, due to the fact that the resulting features are more complex than points, there are several settings to fine-tune the result.
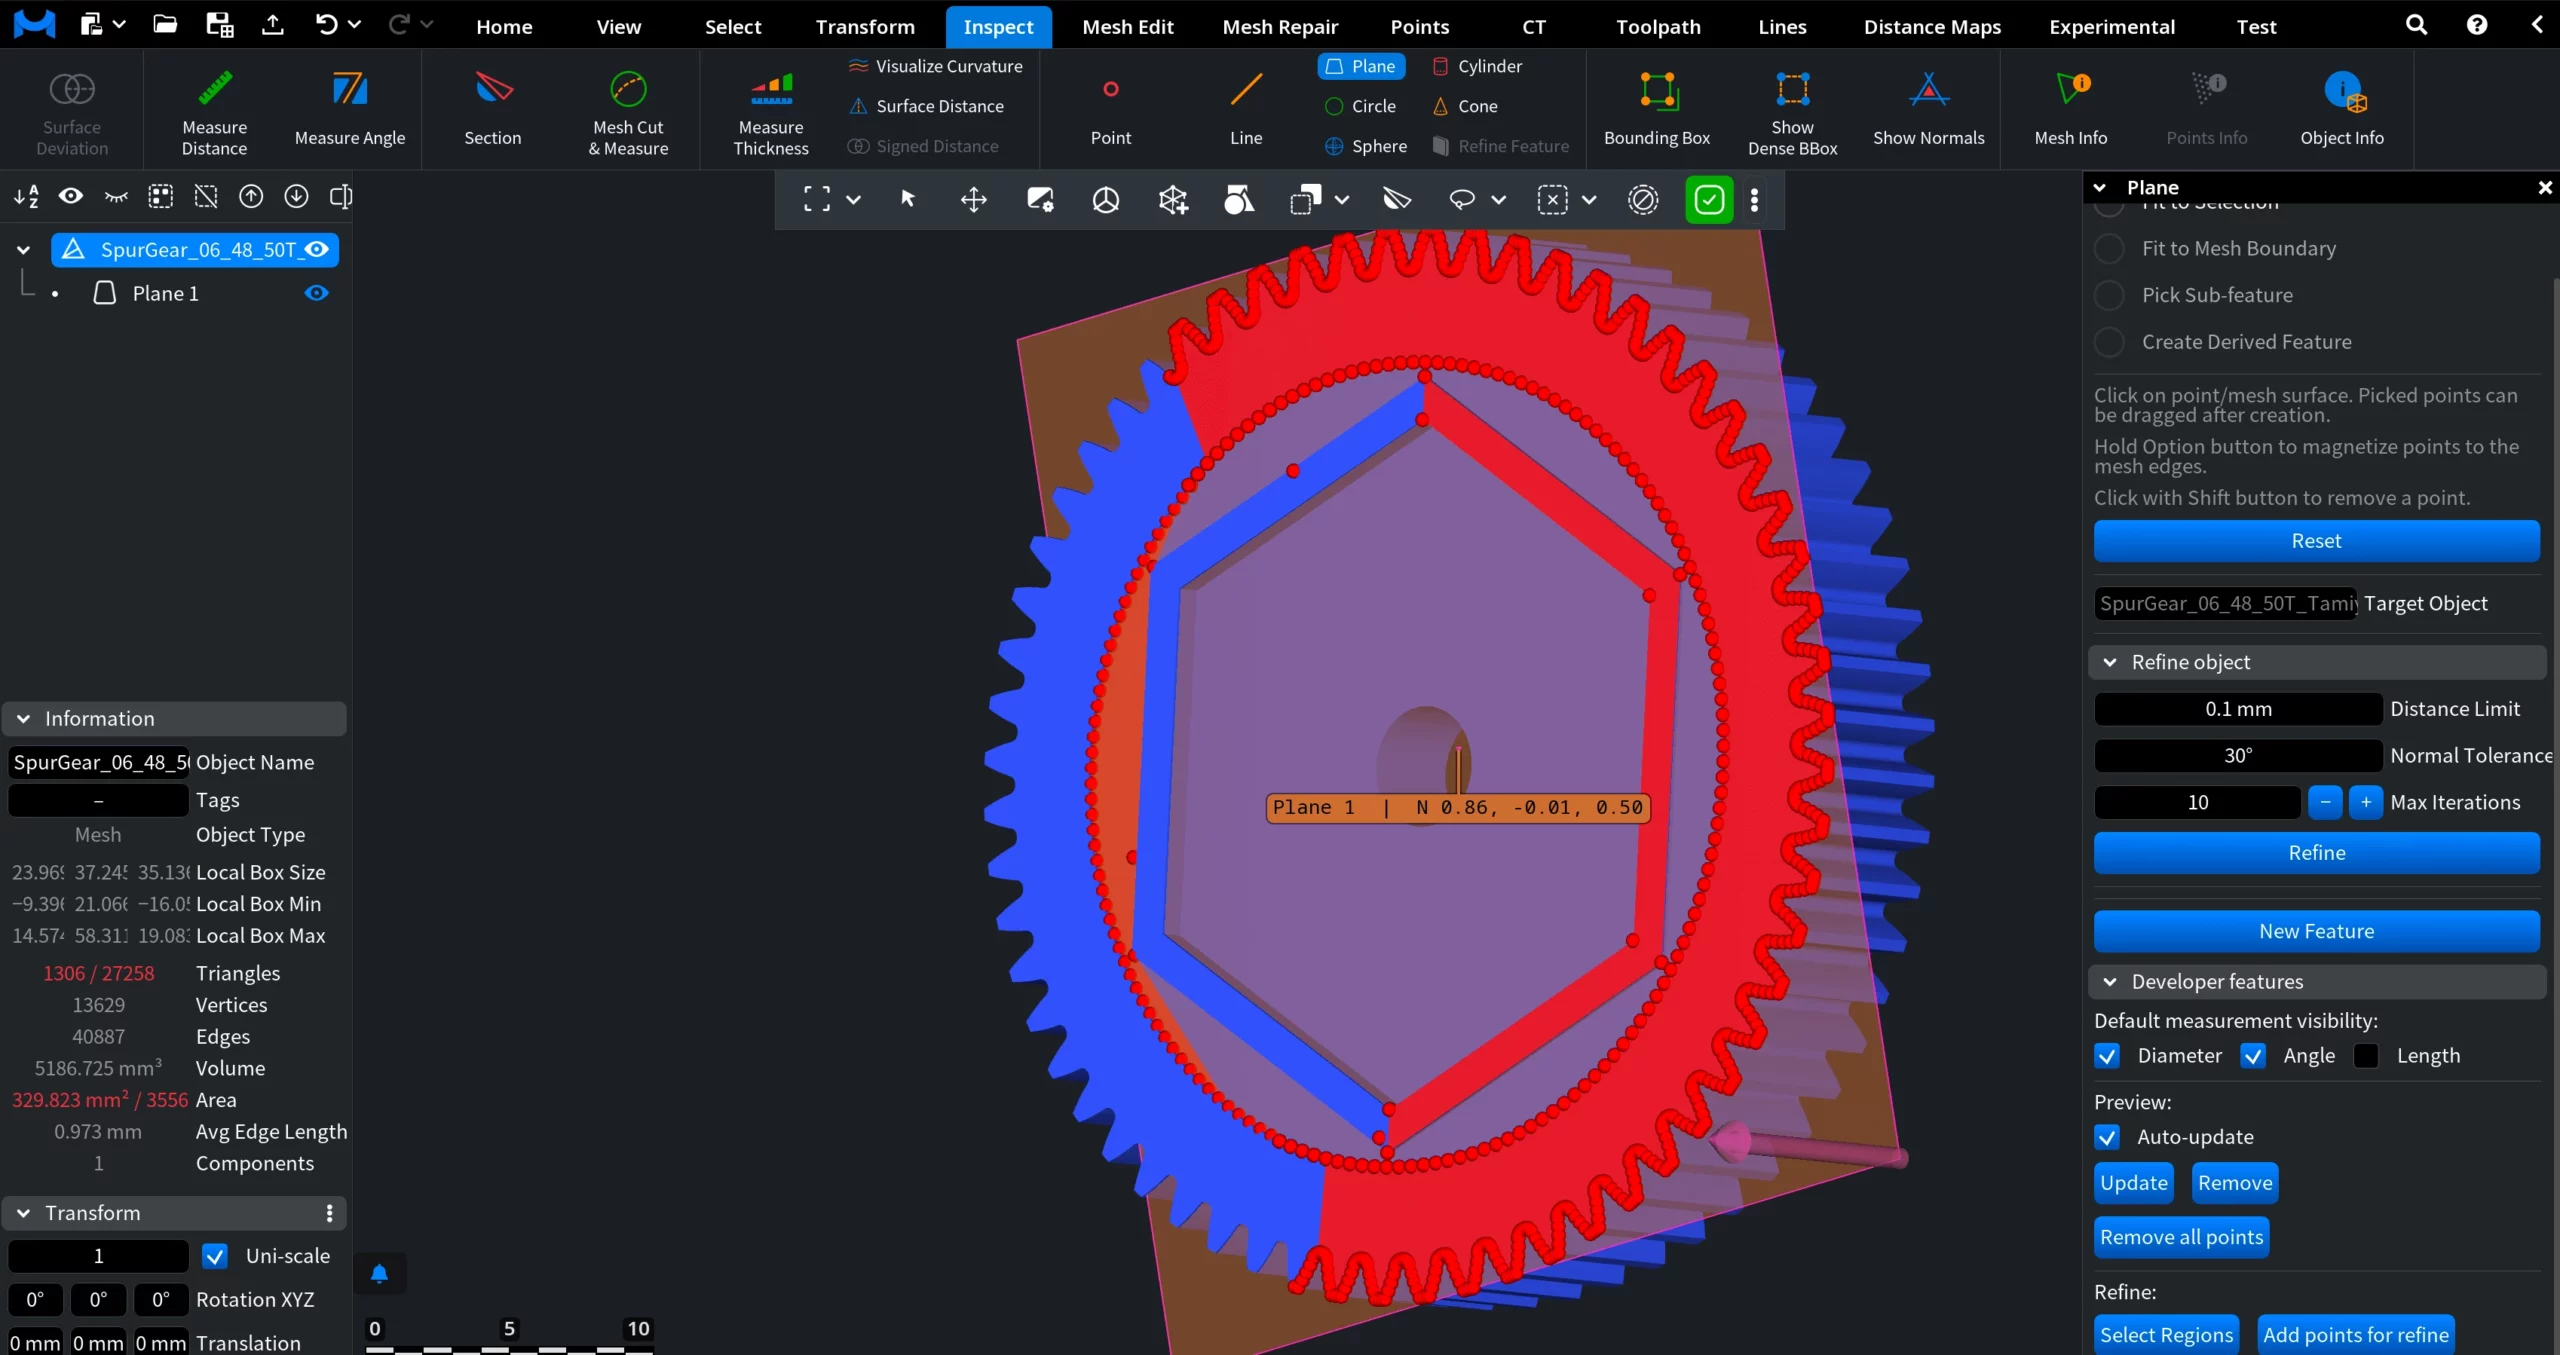
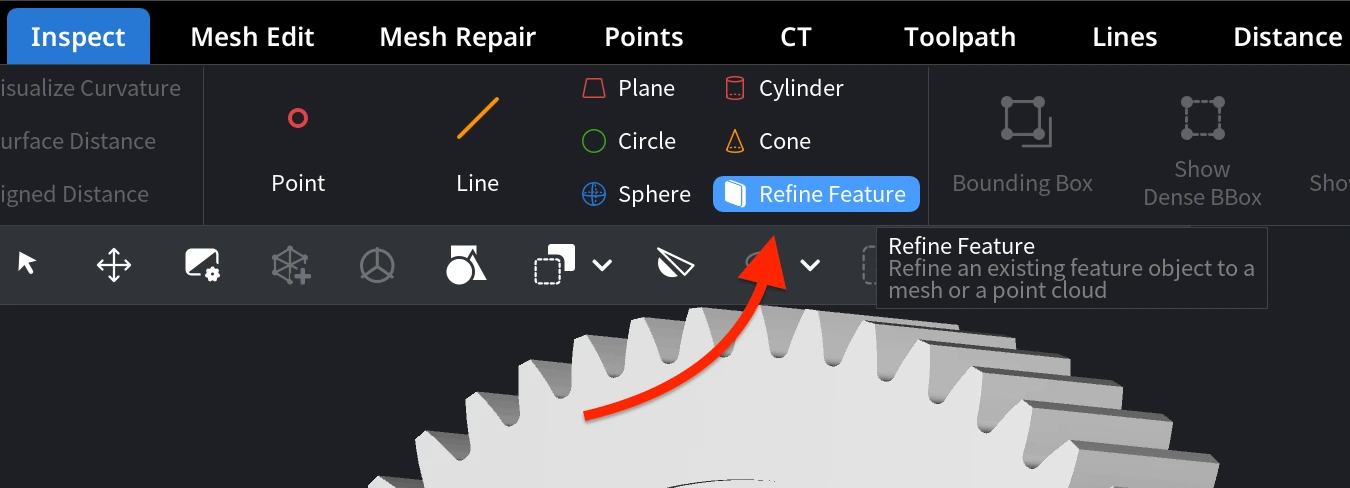
Refine Feature
MeshInspector allows you to refine features by re-fitting them to the underlying mesh geometry. The Refine section includes the following parameters:
- Distance Limit defines how far mesh vertices may be from the feature to be considered during refinement. Smaller values restrict refinement to geometry close to the feature.
- Normal Tolerance sets the maximum allowed angular deviation between mesh normals and the feature’s normal. This helps exclude geometry that is oriented differently.
- Max Iterations controls how many refinement steps are performed. More iterations may improve accuracy but increase processing time.
Click Refine to update the feature using the current settings.
Finally, the Select Regions and Add Points for Refine buttons automatically identify relevant mesh areas and sample points for feature refinement.
With the future selected in the Scene Tree, these refinement options can also be accessed through the dedicated Refine Feature button.
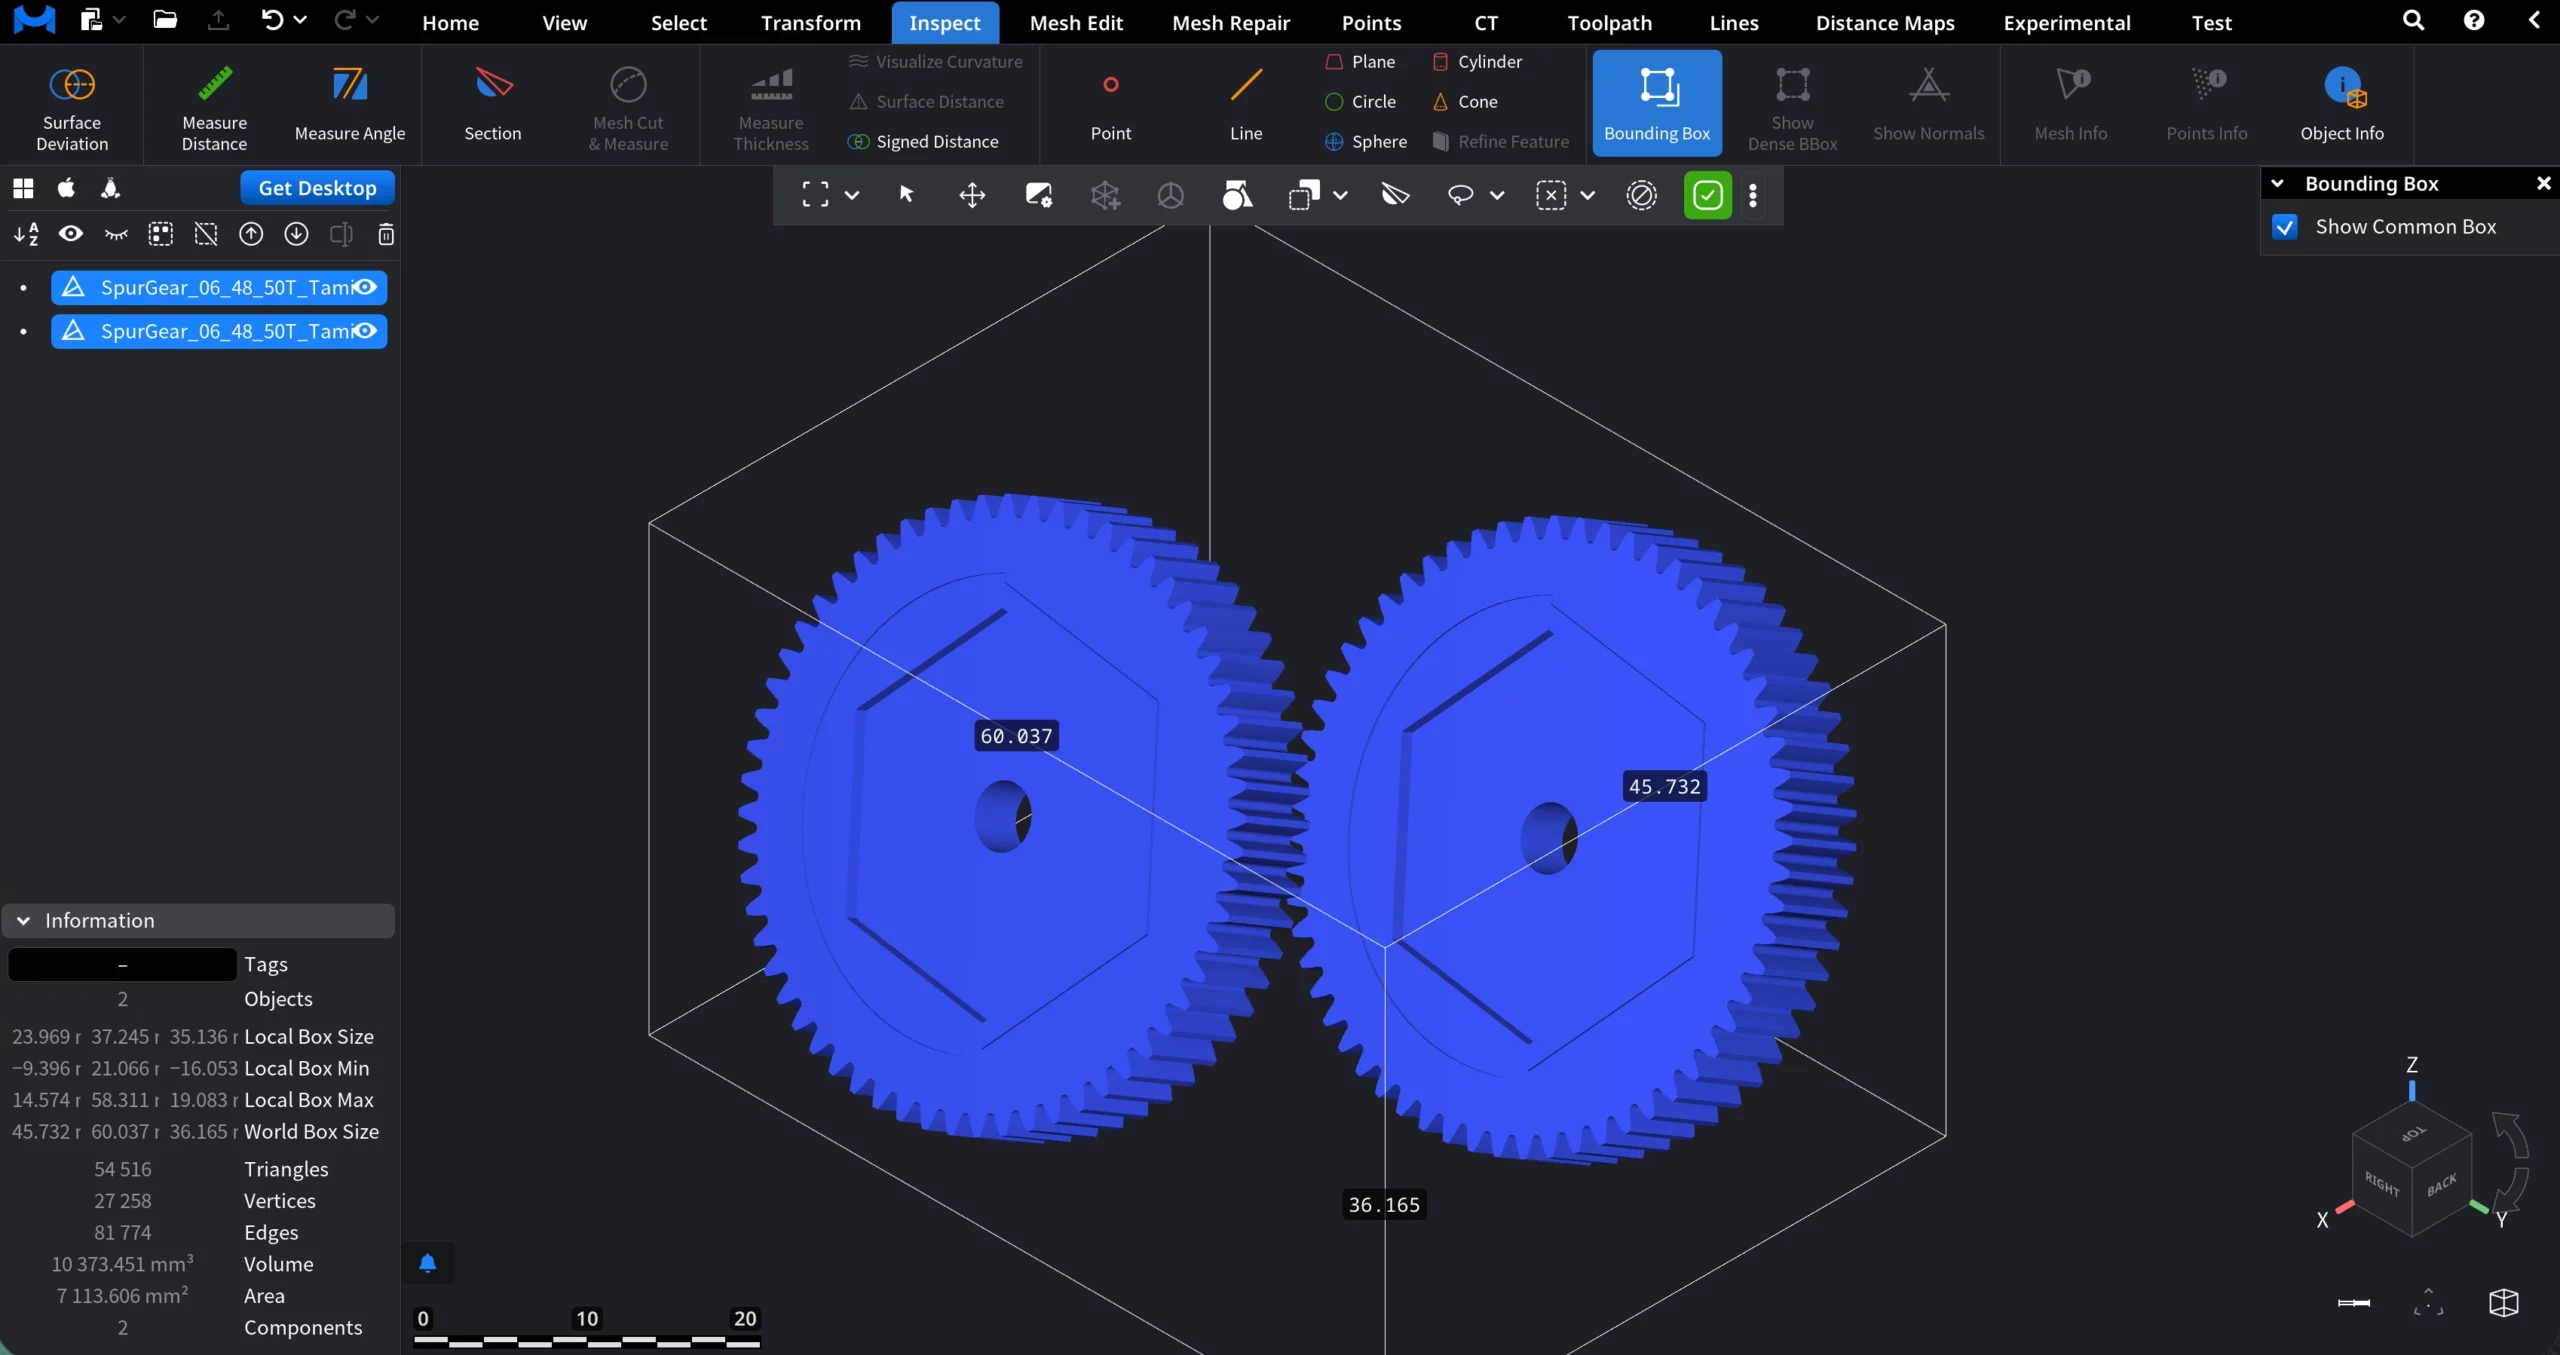
Bounding Box
Bounding Box displays an axis-aligned box that fully encloses the selected object or objects. When enabled, MeshInspector calculates the smallest rectangular volume that contains the entire geometry and draws it in the viewport.
Dense Bounding Box
Dense BBox displays a tighter, geometry-aware bounding box that more closely follows the actual shape of the object. Unlike the Bounding Box, Dense BBox is not limited to a simple axis-aligned extent based only on extreme points. Instead, it analyzes the object’s geometry in more detail to produce a minimal enclosing box.
Show Normals
Show Normals visualizes surface orientation by drawing normal vectors directly on the mesh. Normals indicate the direction each surface element is facing and are essential for inspecting mesh quality, shading behavior, and geometric correctness. When enabled, MeshInspector renders short lines perpendicular to the surface at selected elements.
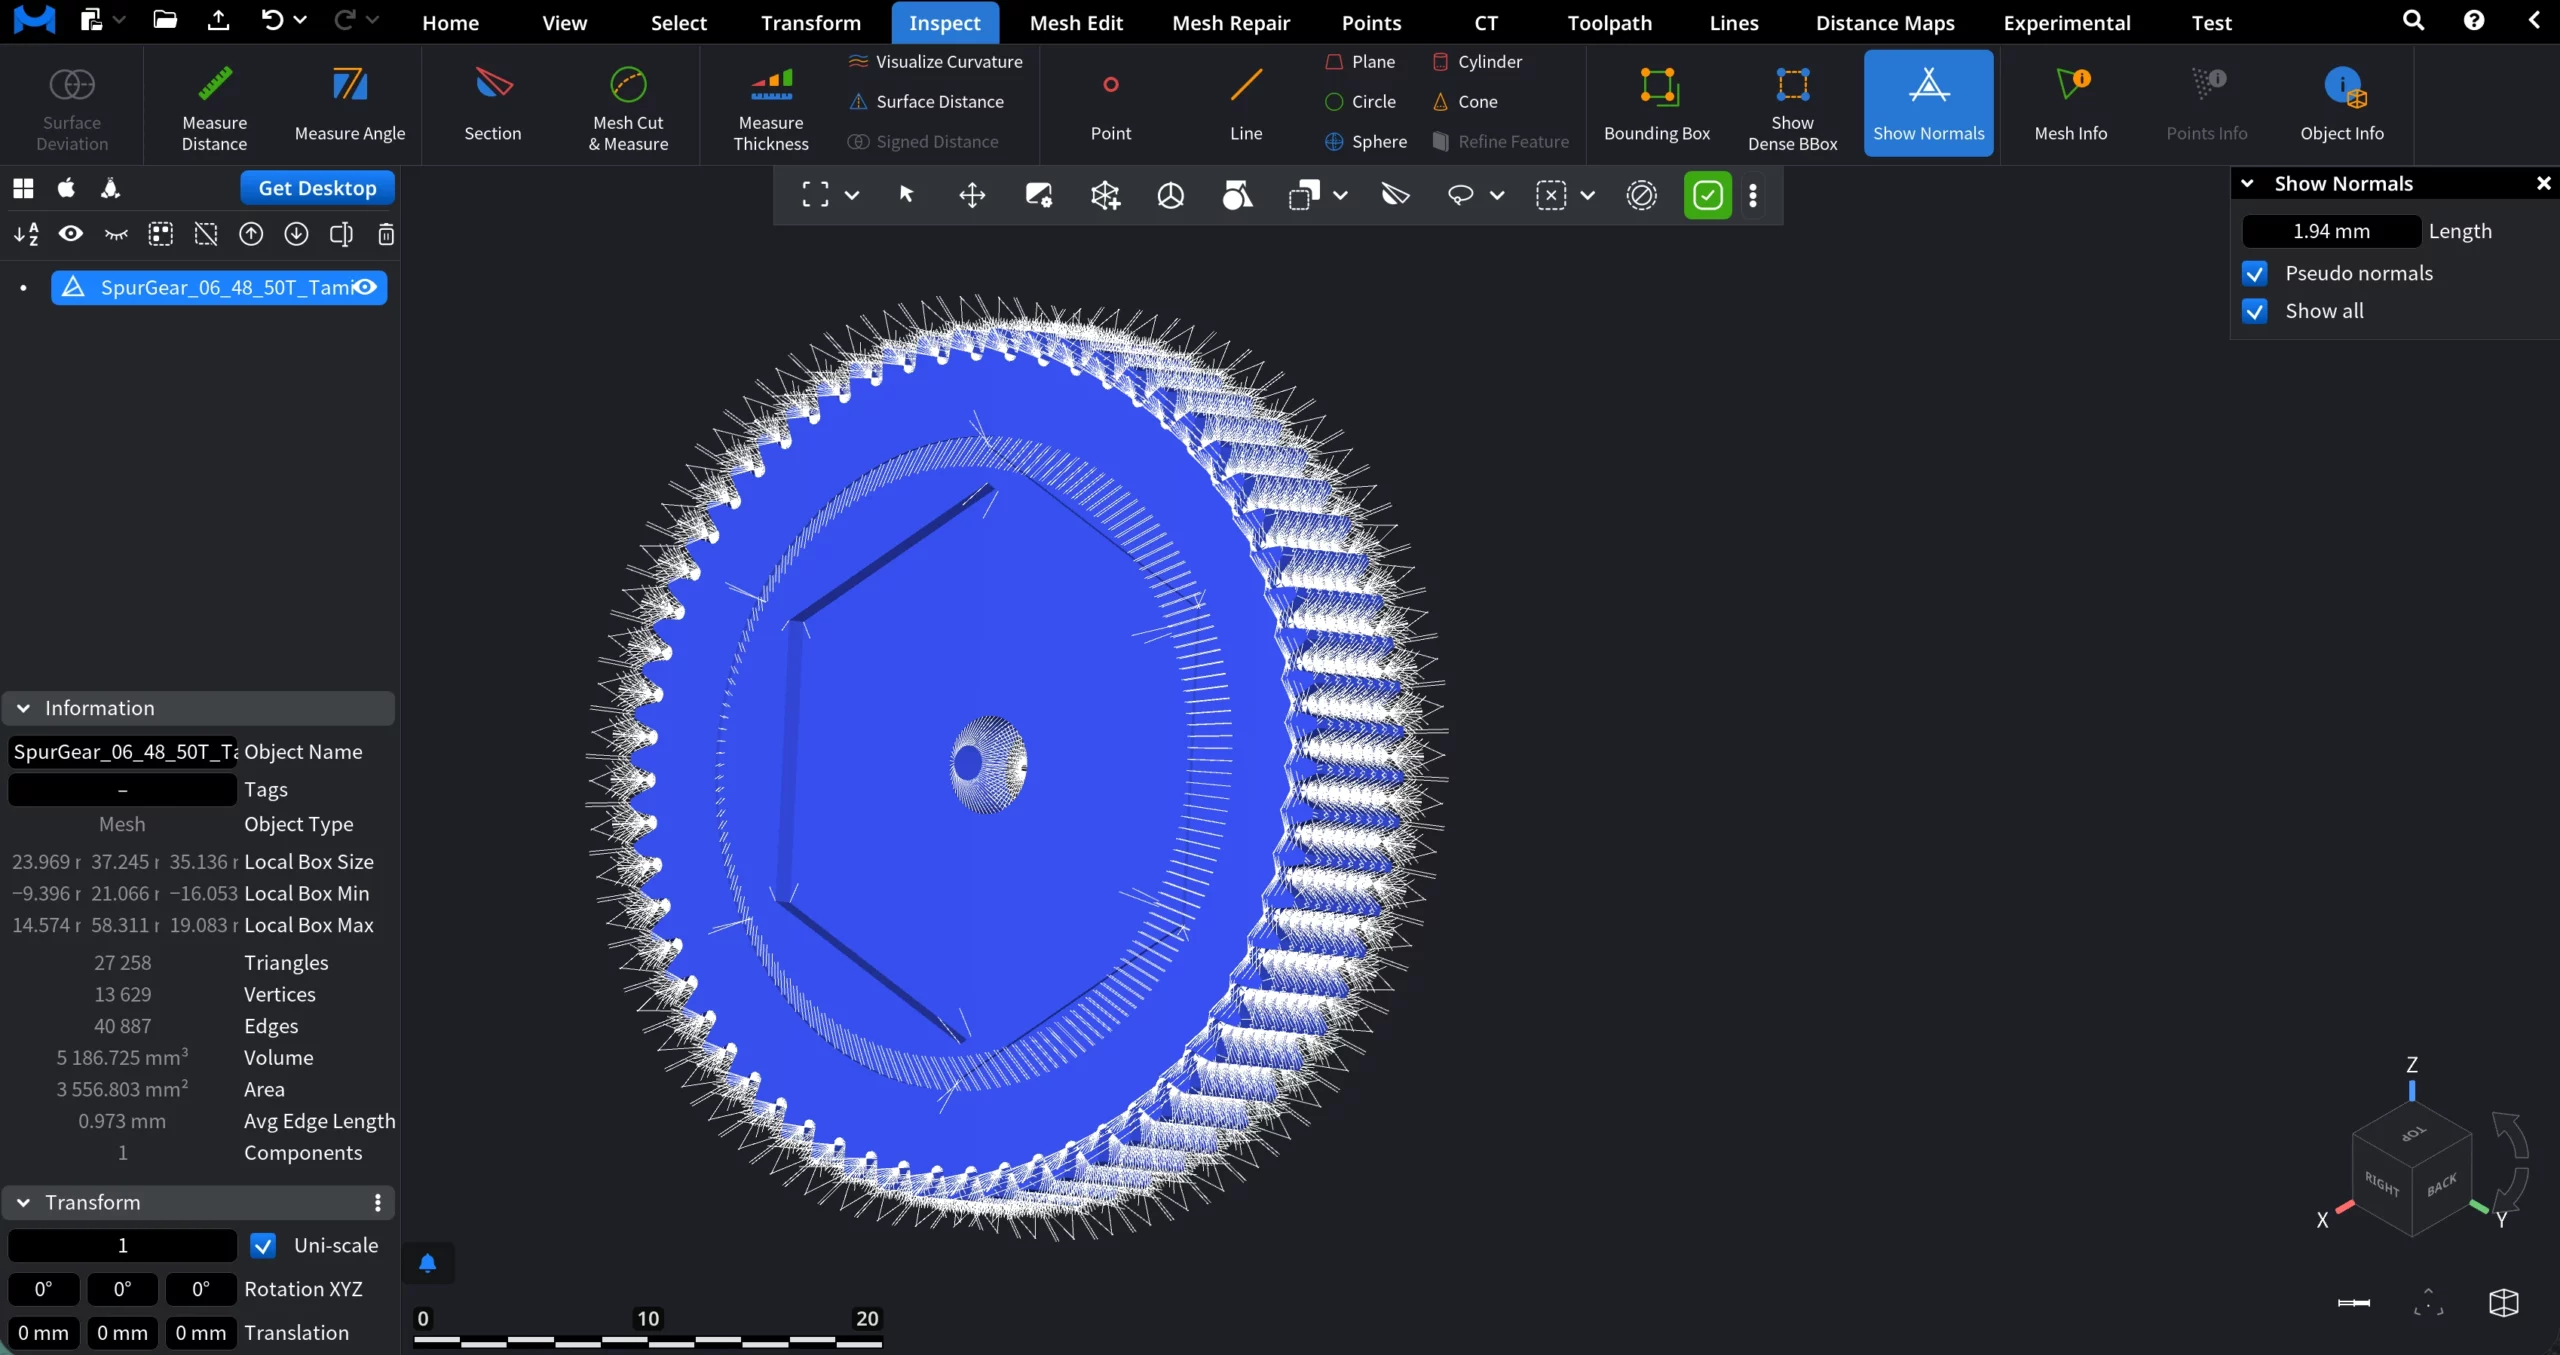
Pseudo Normals
When enabled, MeshInspector displays Pseudo Normals instead of true per-face or per-vertex normals.
Show All
When enabled, Show All displays normals for all available elements of the object at once. When Show All is disabled, you can inspect normals for specific mesh elements instead of the entire object:
- Picked Vertex ID lets you visualize normals for a single vertex by entering its vertex ID. Only the normal associated with the specified vertex is displayed. If the ID is invalid, no normals are shown.
- Show Neighbors. When enabled, normals of vertices adjacent to the picked one are also displayed.
- Length controls the visual size of the displayed normal vectors. Changing this value affects only how normals are rendered on screen and does not modify the mesh geometry.
Now, if Pseudo Normals is enabled while Show All is disabled, MeshInspector displays pseudo normals only for the selected element type and ID.
Pseudo Mode
Pseudo Mode defines which type of element is used to generate normals:
-
Vertex displays a pseudo normal based on the selected vertex.
-
Edge displays a pseudo normal derived from the selected edge.
-
Face displays a pseudo normal based on the selected face.
Here, the Picked ID field specifies the exact vertex, edge, or face for which the pseudo normal is displayed.
If the entered ID is invalid, no normals are visualized.
Show Neighbors. When enabled, pseudo normals of adjacent elements are displayed alongside the selected one. This helps evaluate orientation continuity across nearby geometry and identify sharp transitions or inconsistencies.
Length controls the visual size of the pseudo normal vectors.
Mesh Info
The Mesh Info tool provides detailed, low-level information about the selected mesh and its individual elements. It is primarily intended for inspection, debugging, and in-depth analysis of mesh topology.
Display Options
- Show Selected Items
- Show Triangle Labels
- Show Edge Labels
- Show Vert Labels
- Show Neighbor Labels
- Inspection Modes
Mesh Info supports three mutually exclusive modes:
-
Tri Mode displays information for a selected triangle, including:
-
Triangle ID
-
Vertex IDs and coordinates
-
Triangle normal
-
Area
-
Circumradius
-
Aspect ratio
-
-
Edge Mode displays information for a selected edge, including:
-
Edge ID
-
Origin and destination vertices
-
Left and right adjacent faces
-
Edge vector
-
Length
-
Dihedral angle
-
Cotangent weight
Navigation buttons (Next Origin Edge, Prev. Origin Edge, Sym. Edge) allow traversing connected edges without manually selecting them in the viewport.
-
-
Vert Mode displays information for a selected vertex, including:
-
Vertex ID
-
Exact 3D coordinates
-
Connected edges and faces
-
ID Navigation
For each mode, you can manually browse elements using the ID field with + and - buttons.
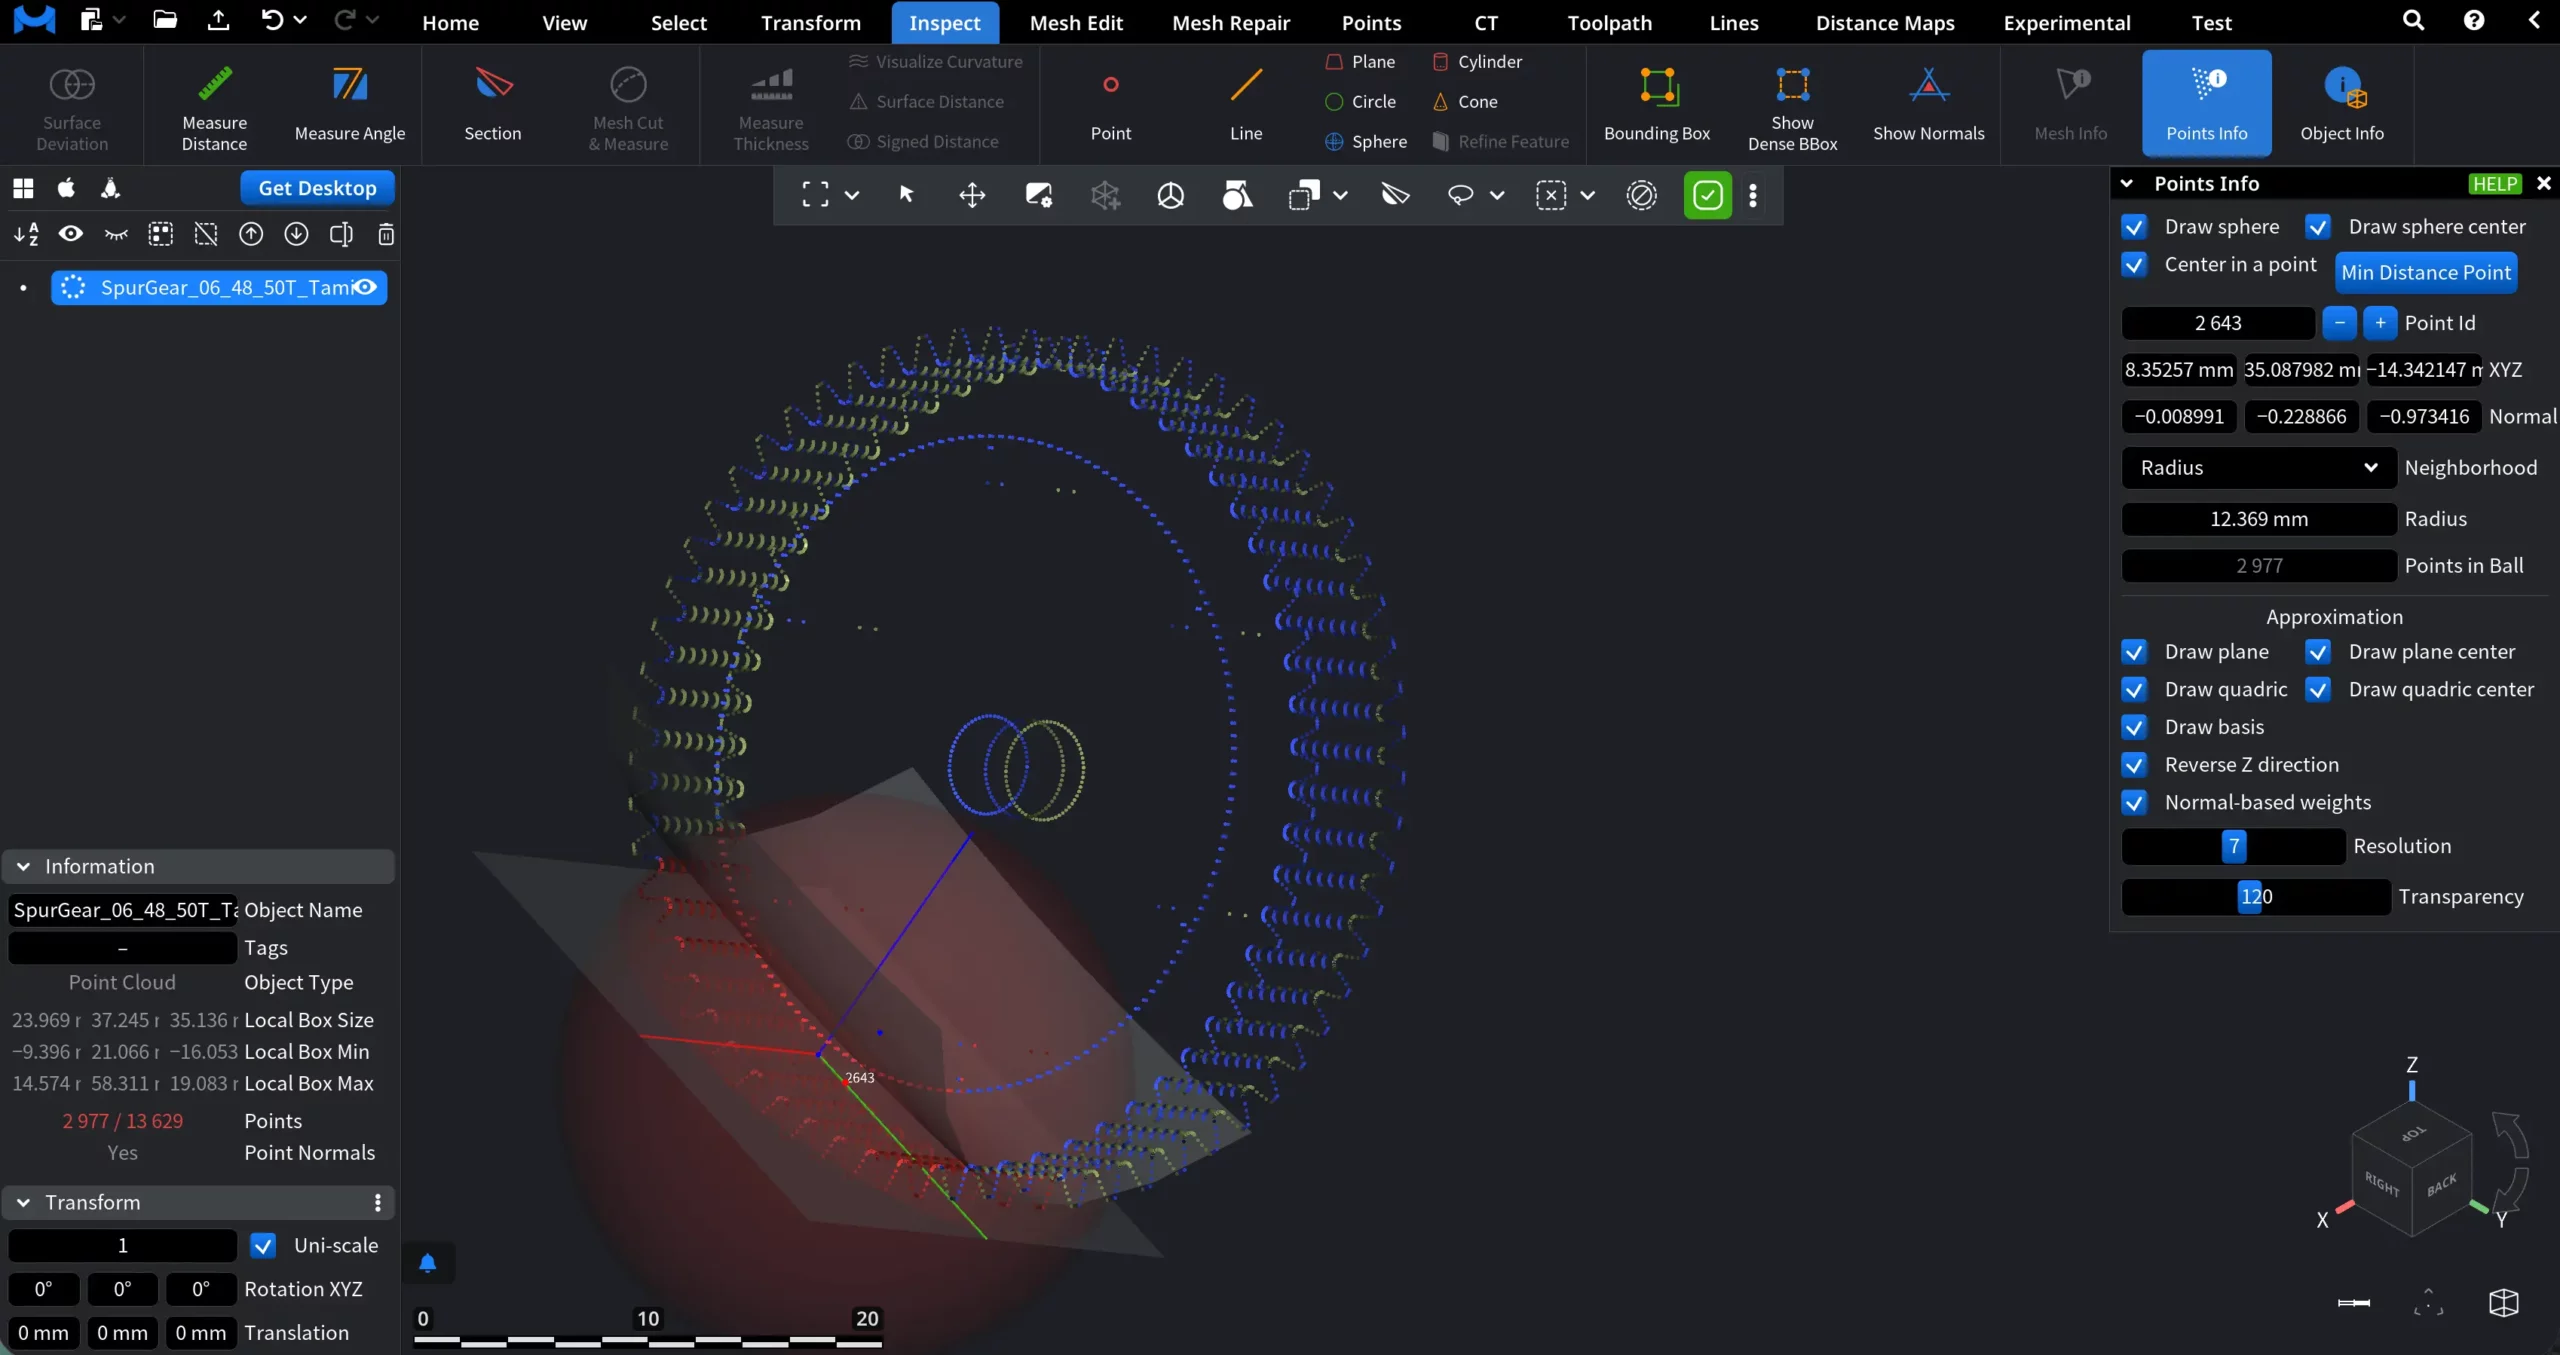
Points Info
Points Info provides detailed inspection and analysis tools for point cloud data. It allows you to examine individual points, their local neighborhoods, and fitted geometric approximations directly in the viewport.
-
Draw sphere visualizes the neighborhood radius as a sphere
-
Draw sphere center marks the center of the neighborhood
-
Center in a point centers the analysis on the selected point
-
Min Distance Point automatically selects the point with the minimum distance to its neighborhood
Point Selection and Position
-
Point Id lets you inspect a specific point by its index.
-
The XYZ fields display the exact coordinates of the selected point.
-
Normal shows the normal vector at the selected point.
Neighborhood
The Neighborhood section defines which nearby points are used for local analysis:
1. Radius selects all points within a given radius around the center point. Here, Points in Ball shows how many points are currently included in the neighborhood.
2. Number of points a certain number of neighboring points. Users can set it via the Num Points field. Also, the resulting Radius will be shown.
Approximation
Points Info can approximate local geometry based on the selected neighborhood:
- Draw plane
- Draw plane center
- Draw quadric
- Draw quadric center
- Draw basis
- Reverse Z direction
- Normal-based weights
Resolution controls the smoothness of the displayed approximation.
Transparency controls the visual opacity of auxiliary geometry.
Object Info
Clicking on Object Info allows you to see a special tab that contains exhaustive information about the object currently chosen by you.