Open DICOM images (CT, MRI, etc.), view 2D voxel slices and 3D volume renderings with heatmap‑style colors, preserving accurate scale.


Watch our quick video or read:
A DICOM viewer is a software that opens and displays medical scans, from X-rays to MRIs. Every hospital and clinic uses DICOM files because they hold the images and important patient data in one secure package. When looking at any medical scan, a viewer is your go-to tool. MeshInspector delivers a state-of-the-art open-source DICOM viewer that expertly handles both .dicom file formats and RAW DICOM data. The system achieves processing speeds five times faster than industry standards through advanced algorithmic optimization. This remarkable performance comes without compromising image quality, maintaining the precise detail and clarity essential for diagnosis or treatment planning.
|
MeshInspector
|
MeshInspector
|
Other STL Readers
|
|
|---|---|---|---|
| Perfomance |
Ultra-fast (GPU acceleration)
|
High
|
Slow
|
| Batch Import |
Unlimited
|
Unlimited
|
Single file
|
| File Limits |
Unlimited
|
Unlimited
|
~100 MB
|
| Measurement Tools |
Advanced
|
Advanced
|
Limited
|
| Metadata Support |
Full
|
Full
|
Not supported
|
| Scaling |
Advanced
|
Advanced
|
Not supported
|
| 3D Editor |
Advanced
|
Advanced
|
Not supported
|
| Screenshots |
Advanced
|
Advanced
|
Limited
|
| Supported Files |
STL (ASCII/Binary), OBJ, PLY, GLTF
|
STL (ASCII/Binary), OBJ, PLY, GLTF
|
STL (Binary)
|
| Export |
Multiple formats
|
Multiple formats
|
Not supported
|
| Security & Privacy |
Corporate security + Local storage
|
SSL + Auto-delete
|
Server-side storage
|
| Cross-Platform |
Windows, macOS, Linux
|
All devices
|
Web only, poor mobile UX
|
| Suitable for |
Professional & industrial use
|
Quick viewing & sharing
|
Not recommended
|
Join thousands of engineers who trust MeshInspector for their 3D file conversion needs. Start converting today with no limits and professional results.
Explore the full MeshInspector ecosystem — advanced 3D model viewers and converters for engineers, designers, and makers.
Professionals working with medical imaging often need a reliable read DICOM file program. Namely, a tool capable of loading large scan folders, organizing volumes, and displaying CT data clearly across any operating system. The MeshInspector program excels here. It is a free and cross-platform viewing solution, designed to open, preview, and inspect DICOM volumes. It is possible both directly in your browser and in the desktop application, providing you with an efficient way to explore voxel data without complicated setup.
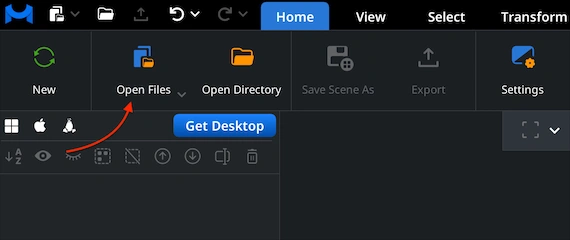
Go to the ’CT’ tab and click ‘Open DICOMs’. This option loads all DICOM volumes from a selected folder, including its sub-folders. After you choose the folder that contains your scans, MeshInspector will enable you to automatically import the full dataset and prepare it for viewing.
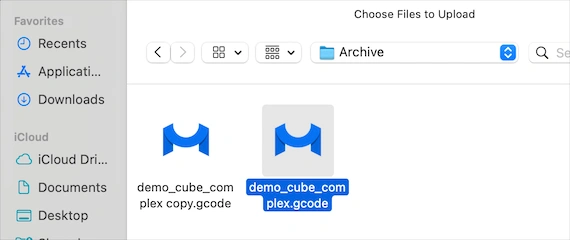
In the file browser, navigate to the directory that contains your DICOM study. As shown, simply select the folder with all the DICOM slices inside (in this case, 427 items). Our program will read the entire folder, so there is no need to pick anything. Confirm the selection to load the full volume.
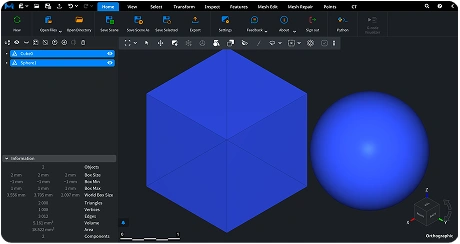
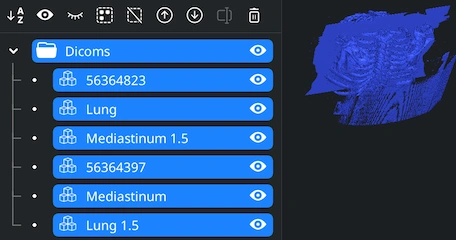
After import, all extracted volumes appear in the Scene Tree as separate voxel objects. Each reconstructed structure can be viewed independently or together. Use the eye icons to toggle visibility and explore the dataset interactively. Rotate the view with the left mouse button, pan with the right button or a two-finger gesture, and zoom using the mouse wheel or pinch gesture.
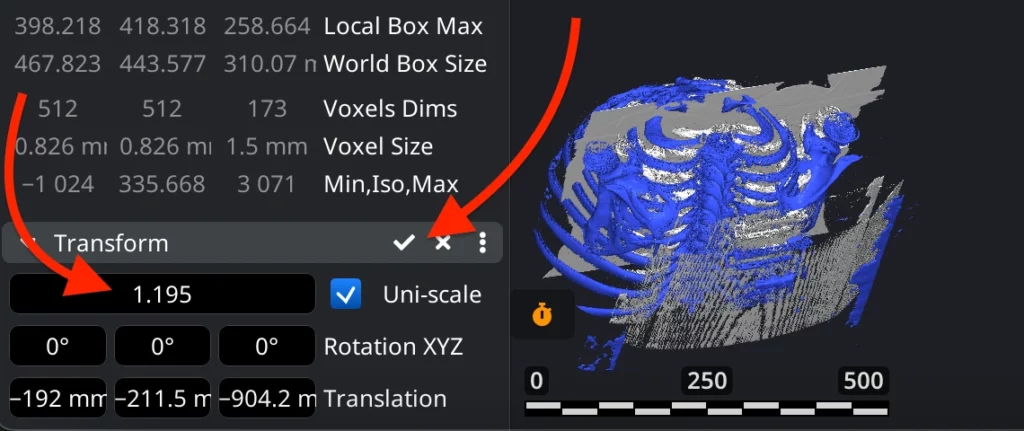
To resize a DICOM volume, first select the desired object in the Scene Tree. Then go to the ’Transform’ panel in the lower-left corner. Use the Scale field to increase or decrease the size of the voxel object. After entering the needed value, apply the transformation by clicking the checkmark icon. The volume updates immediately, and its bounding box and voxel-dimension values are recalculated accordingly.
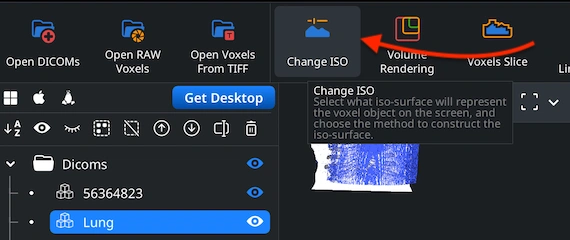
ISO defines which intensity values inside a DICOM become visible as a surface. Adjusting this is essential for viewing. It changes how clearly different anatomical structures appear on the screen. Lower ISO values reveal softer tissues, while higher values emphasize denser regions such as bones. To modify the ISO, select the DICOM volume in the Scene Tree. Then go to the CT tab and click ‘Change ISO.’
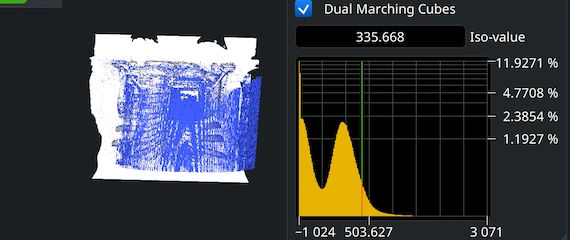
When you open ‘Change ISO’, MeshInspector displays the voxel intensity histogram together with the current ISO-value. This value determines which density level forms the visible surface of your voxel object. Type a new ISO-value directly into the input field or adjust it by dragging the vertical marker. At the top, you can also choose between ‘Dual Marching Cubes’ and the standard Marching Cubes algorithm. Enabling the checkbox often produces cleaner and more stable surfaces around complex features. Turning it off switches to the regular method, which may render faster but can show more issues.
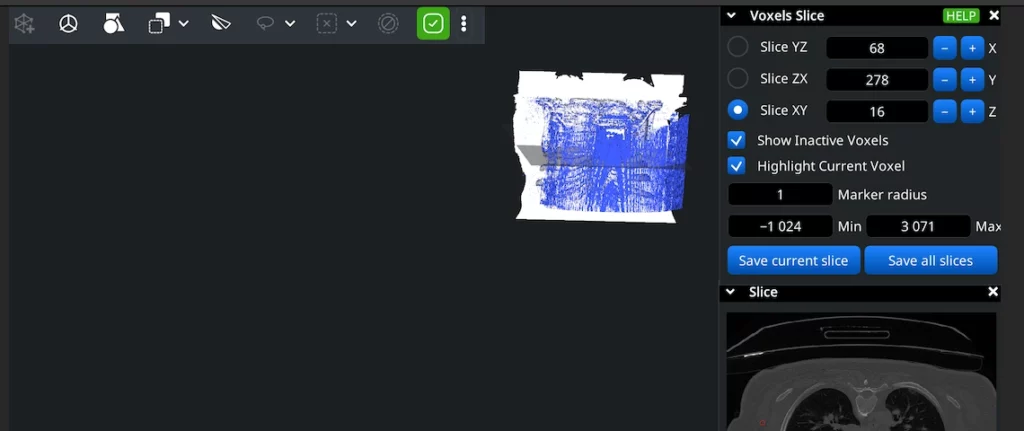
Voxel slices allow you to examine your DICOM volume one layer at a time, revealing the internal anatomy that may be hidden in the 3D view. As shown, the Voxel Slice panel lets you cut through the scan along the YZ, ZX, or XY planes. Use the +/– buttons to move the slice forward or backward through the volume. Also, you can enter values manually or drag them. The corresponding 2D slice is displayed in the Slice window beneath . You can also enable ’Show Inactive Voxels’ and ’Highlight Current Voxel’ to better understand how the slice interacts with the full dataset. The radius of your marker is also under control.
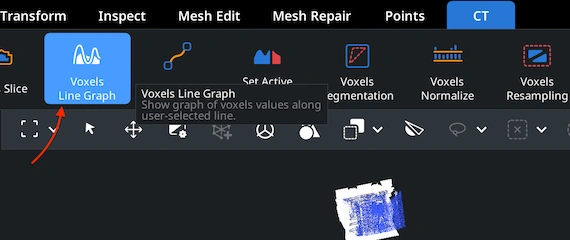
Under the CT tab, click ‘Voxels Line Graph’ to analyze voxel intensity values along any user-defined line in your DICOM volume. In this case, the MeshInspector program will display a graph showing how voxel values change along that line, helping you identify density variations, boundaries, and transitions inside scans.
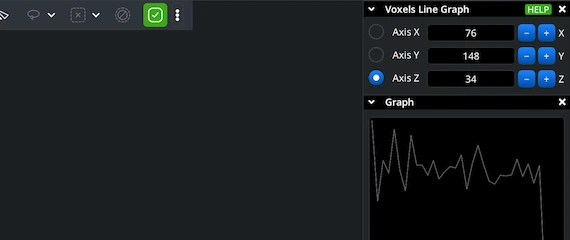
The graph panel appears on the right side of the UI. Here you can examine how voxel intensity changes along a specific axis. X, Y, or Z can be selected to define the direction of the probe line through your volume. Then adjust the numeric value next to the chosen axis to shift the line’s position. As you move the line, the graph below updates instantly.
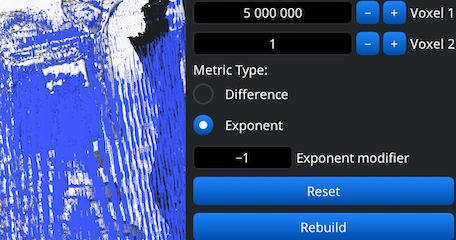
Clicking ‘Voxels Path’ under the ‘CT’ tab enables you to compute the optimal path between two specified voxel positions. The panel on the right lets you define Voxel 1 and Voxel 2 by entering their indices or adjusting them with the plus and minus buttons. Below, you can choose the metric type used for the calculation: 'Difference' or 'Exponent.' After setting your parameters, use the ‘Rebuild’ button to generate a new path or ‘Reset’ to clear the current one. The computed path is drawn directly on the DICOM volume.
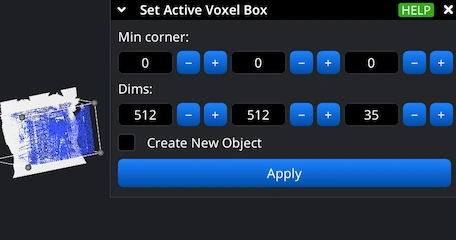
Clicking ‘Set Active Voxel Box’ in the ‘CT’ tab allows you to define a specific sub-region of your DICOM volume to work with. The resulting panel provides two sets of controls. The 'Min corner' values define the starting coordinate of the voxel box. You can adjust each axis using the plus and minus buttons. The 'Dims' values specify the size of the box along each axis. Again, the plus and minus buttons let you fine-tune the dimensions interactively. Optionally, you can enable 'Create New Object' to generate a separate voxel object from the selected region.
100% Secure
No data leaves your device
Integrate real-time 3D visualization, mesh analysis, and measurement tools directly into your applications with MeshLib SDK.
Modern UI — built with Dear ImGui: ribbon interface, scene tree, view cube, and measurement tools.
Order-Independent Transparency (OIT) — realistic rendering of transparent materials.
Customizable Interaction — support for mouse, keyboard, touch gestures, and SpaceMouse devices.
Plugin Architecture — extend the Viewer with your own tools and workflows.