Advice and answers from the MeshInspector Team

Guide to the Quality Control Report Tool and Workflow

Quality Control Report: A Workflow
Updated over 2 weeks ago

In this article, we will show you how to prepare and generate quality control reports in MeshInspector. To demonstrate the full workflow, we will use a sample professional scenario. In the Scene Tree, you can see two objects:

  • The selected object highlighted in blue is the source CAD file. A physical model was printed based on this file.
  • The unselected object shown in white is a scan of the printed model.


The source CAD file serves as the reference model, while the scan is the object we need to inspect. We compare the scan against the CAD geometry to evaluate how accurately the printed part matches the original design.
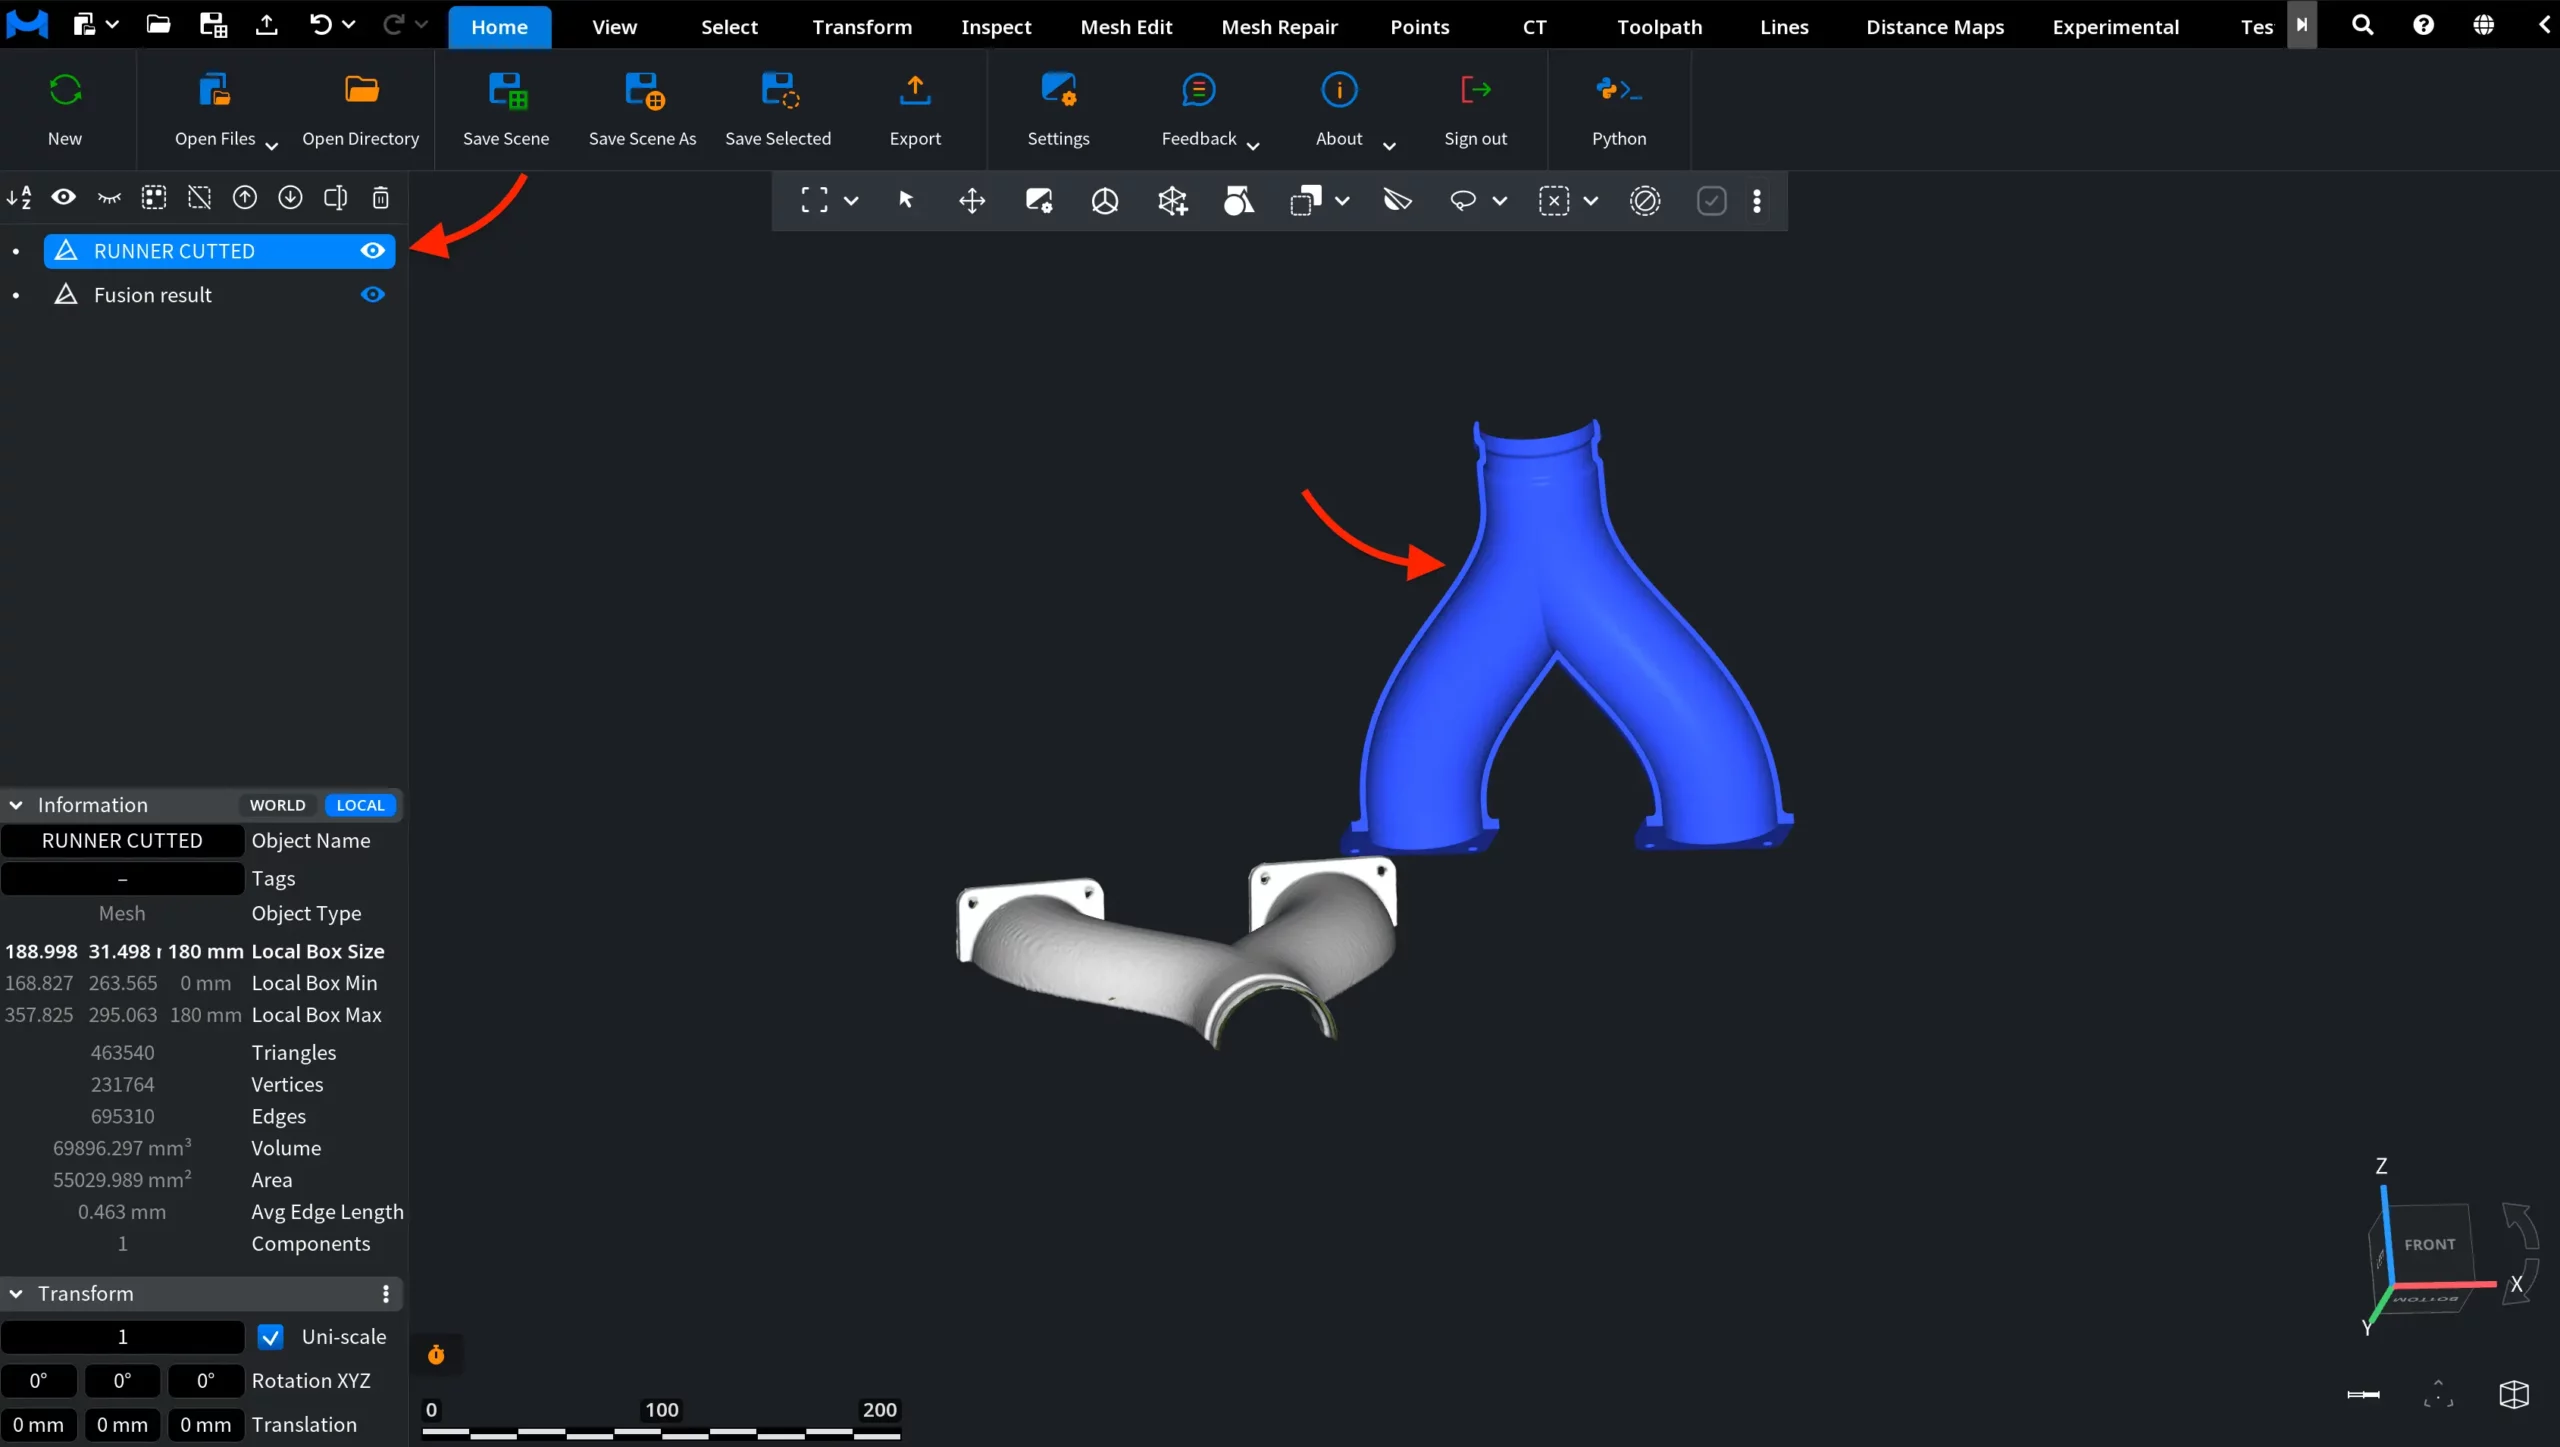
Quality Control: Initial Scene

Step 1. Registration

Our first step is to run Registration. This operation aligns the target object with the reference object by minimizing the difference between them using the iterative closest point, or ICP, algorithm.

In our case, the scan should be registered to the CAD file, not vice versa, because the CAD file is the reference for quality control. With both objects selected, we go to the Transform tab and click Registration. A dedicated Registration panel then opens on the right side of the workspace.
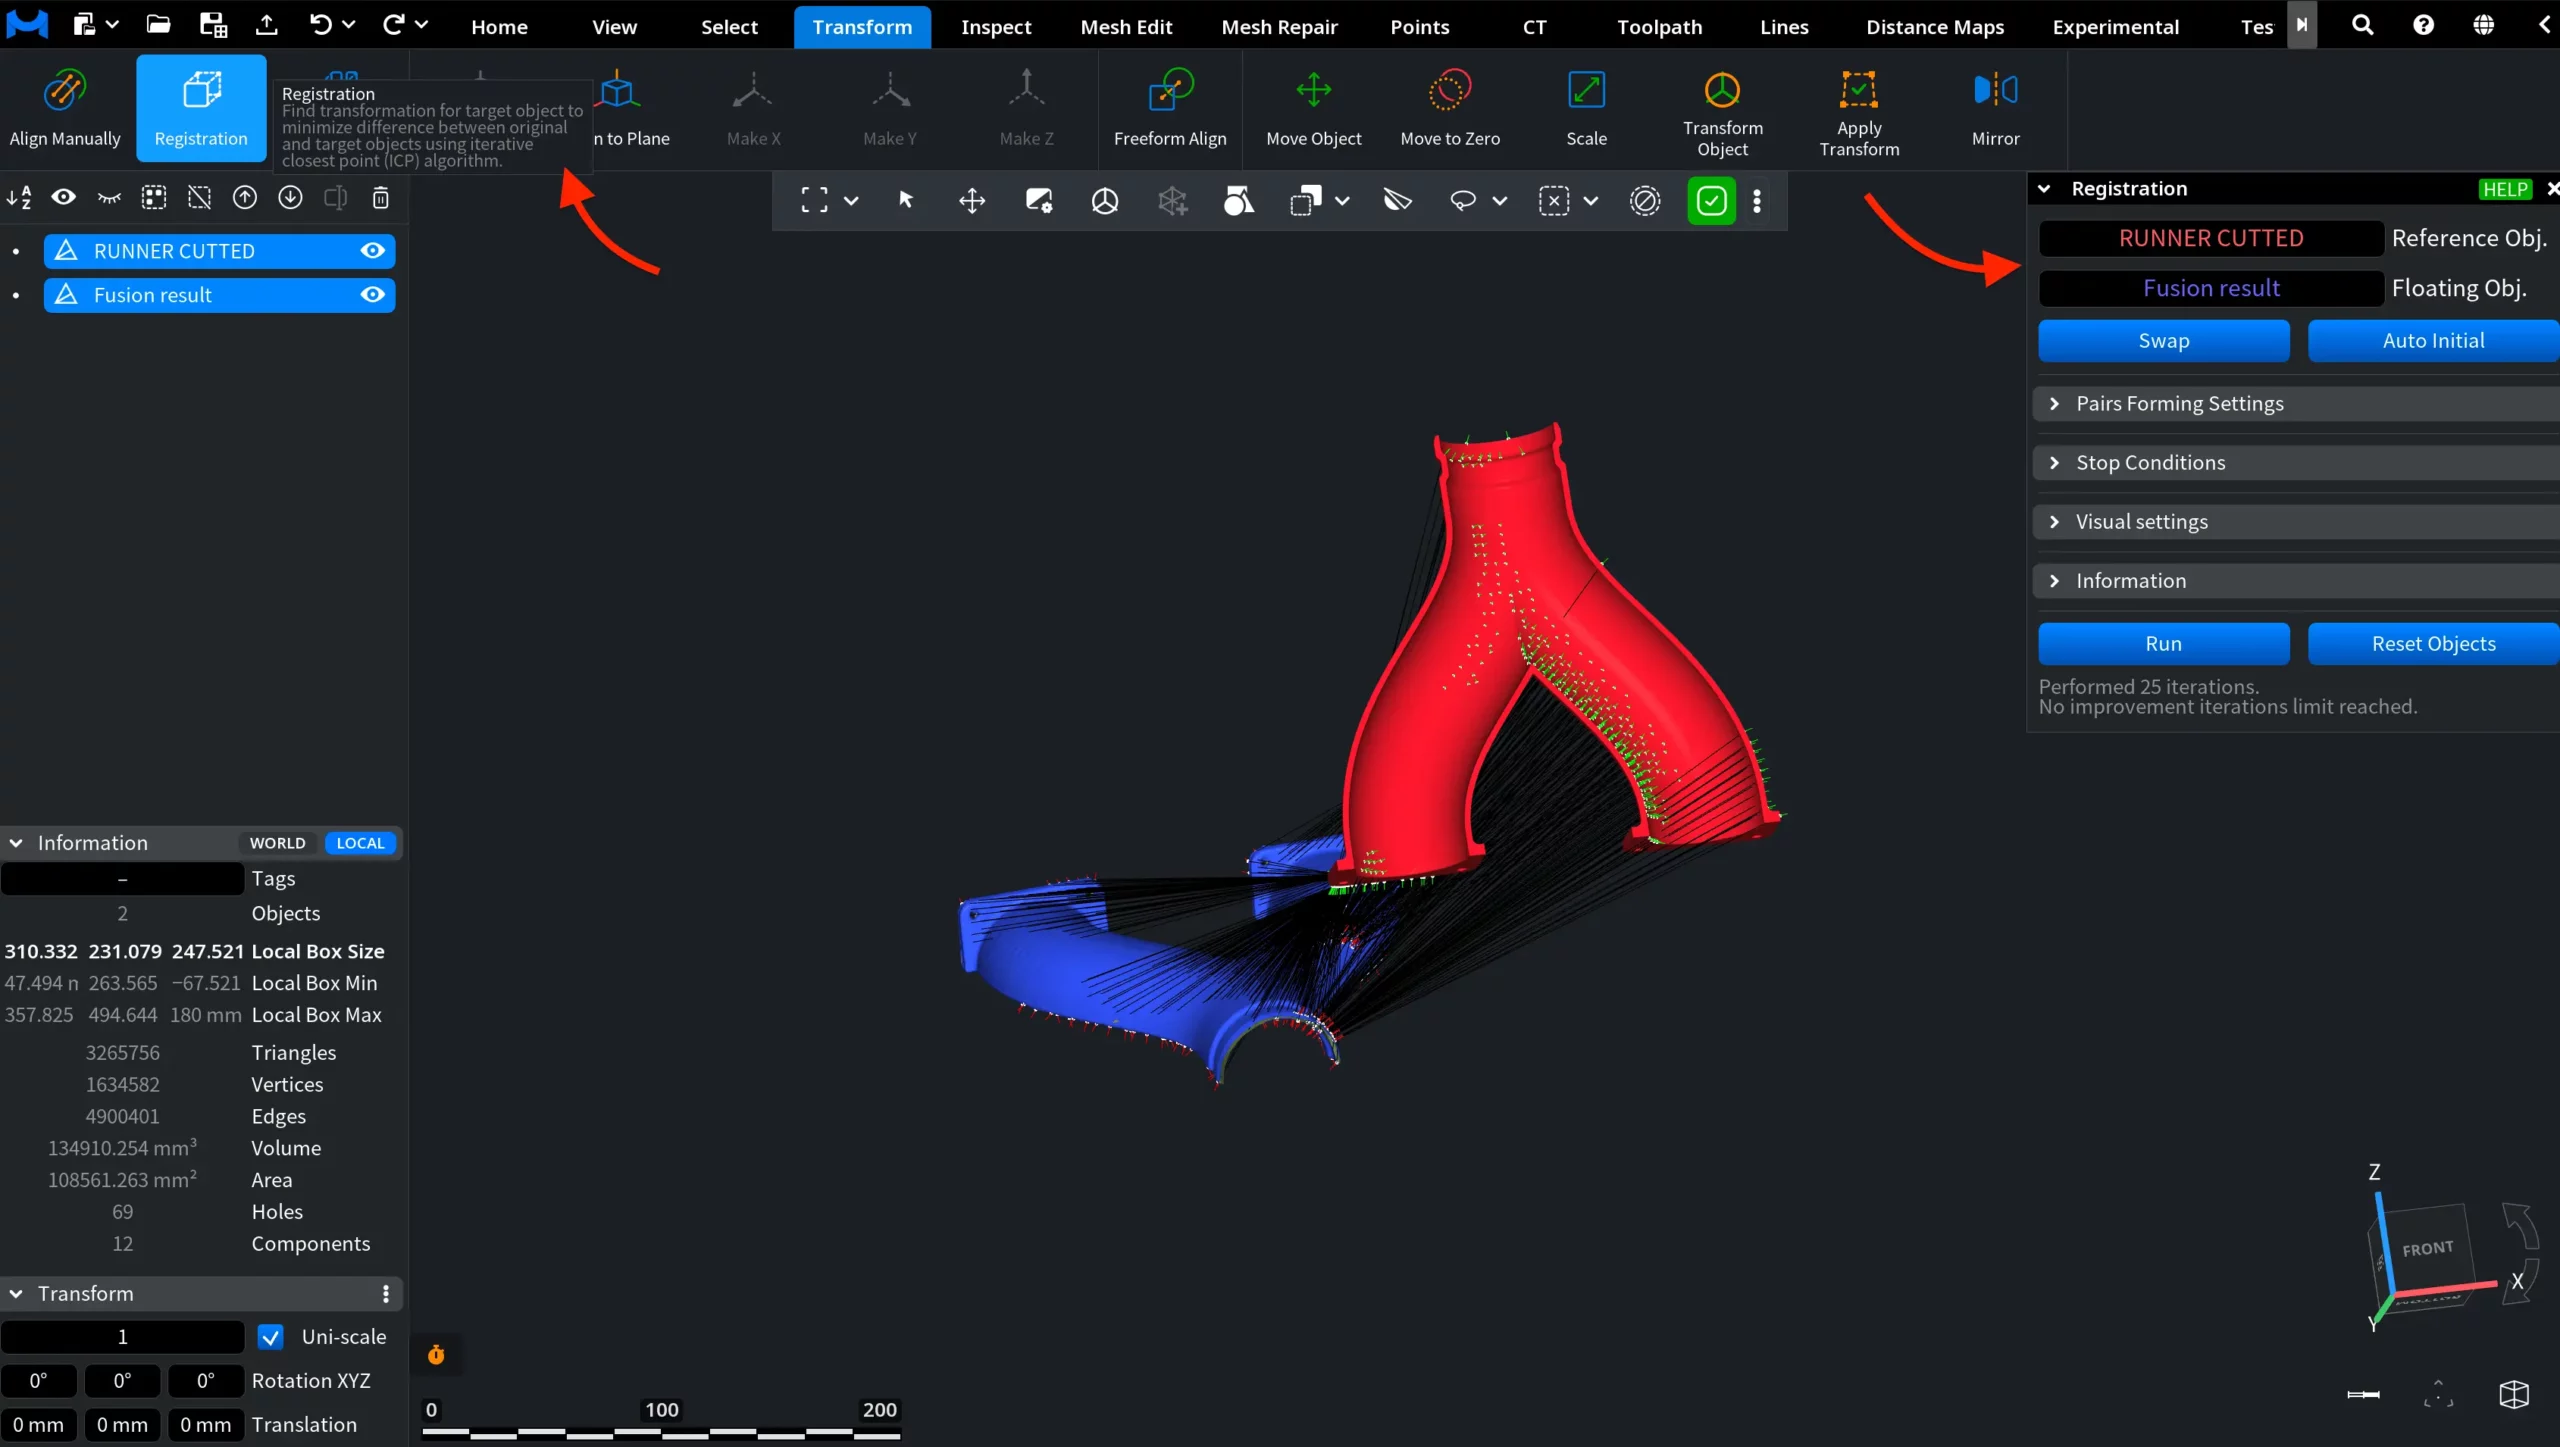
Quality Report: Registration. Before

Next, we click Auto Initial to let MeshInspector automatically select the starting transformation for the floating object. Then we click Run to complete the registration. As a result, the scan is aligned with the CAD file and is ready for further comparison, as shown in the screenshot below.
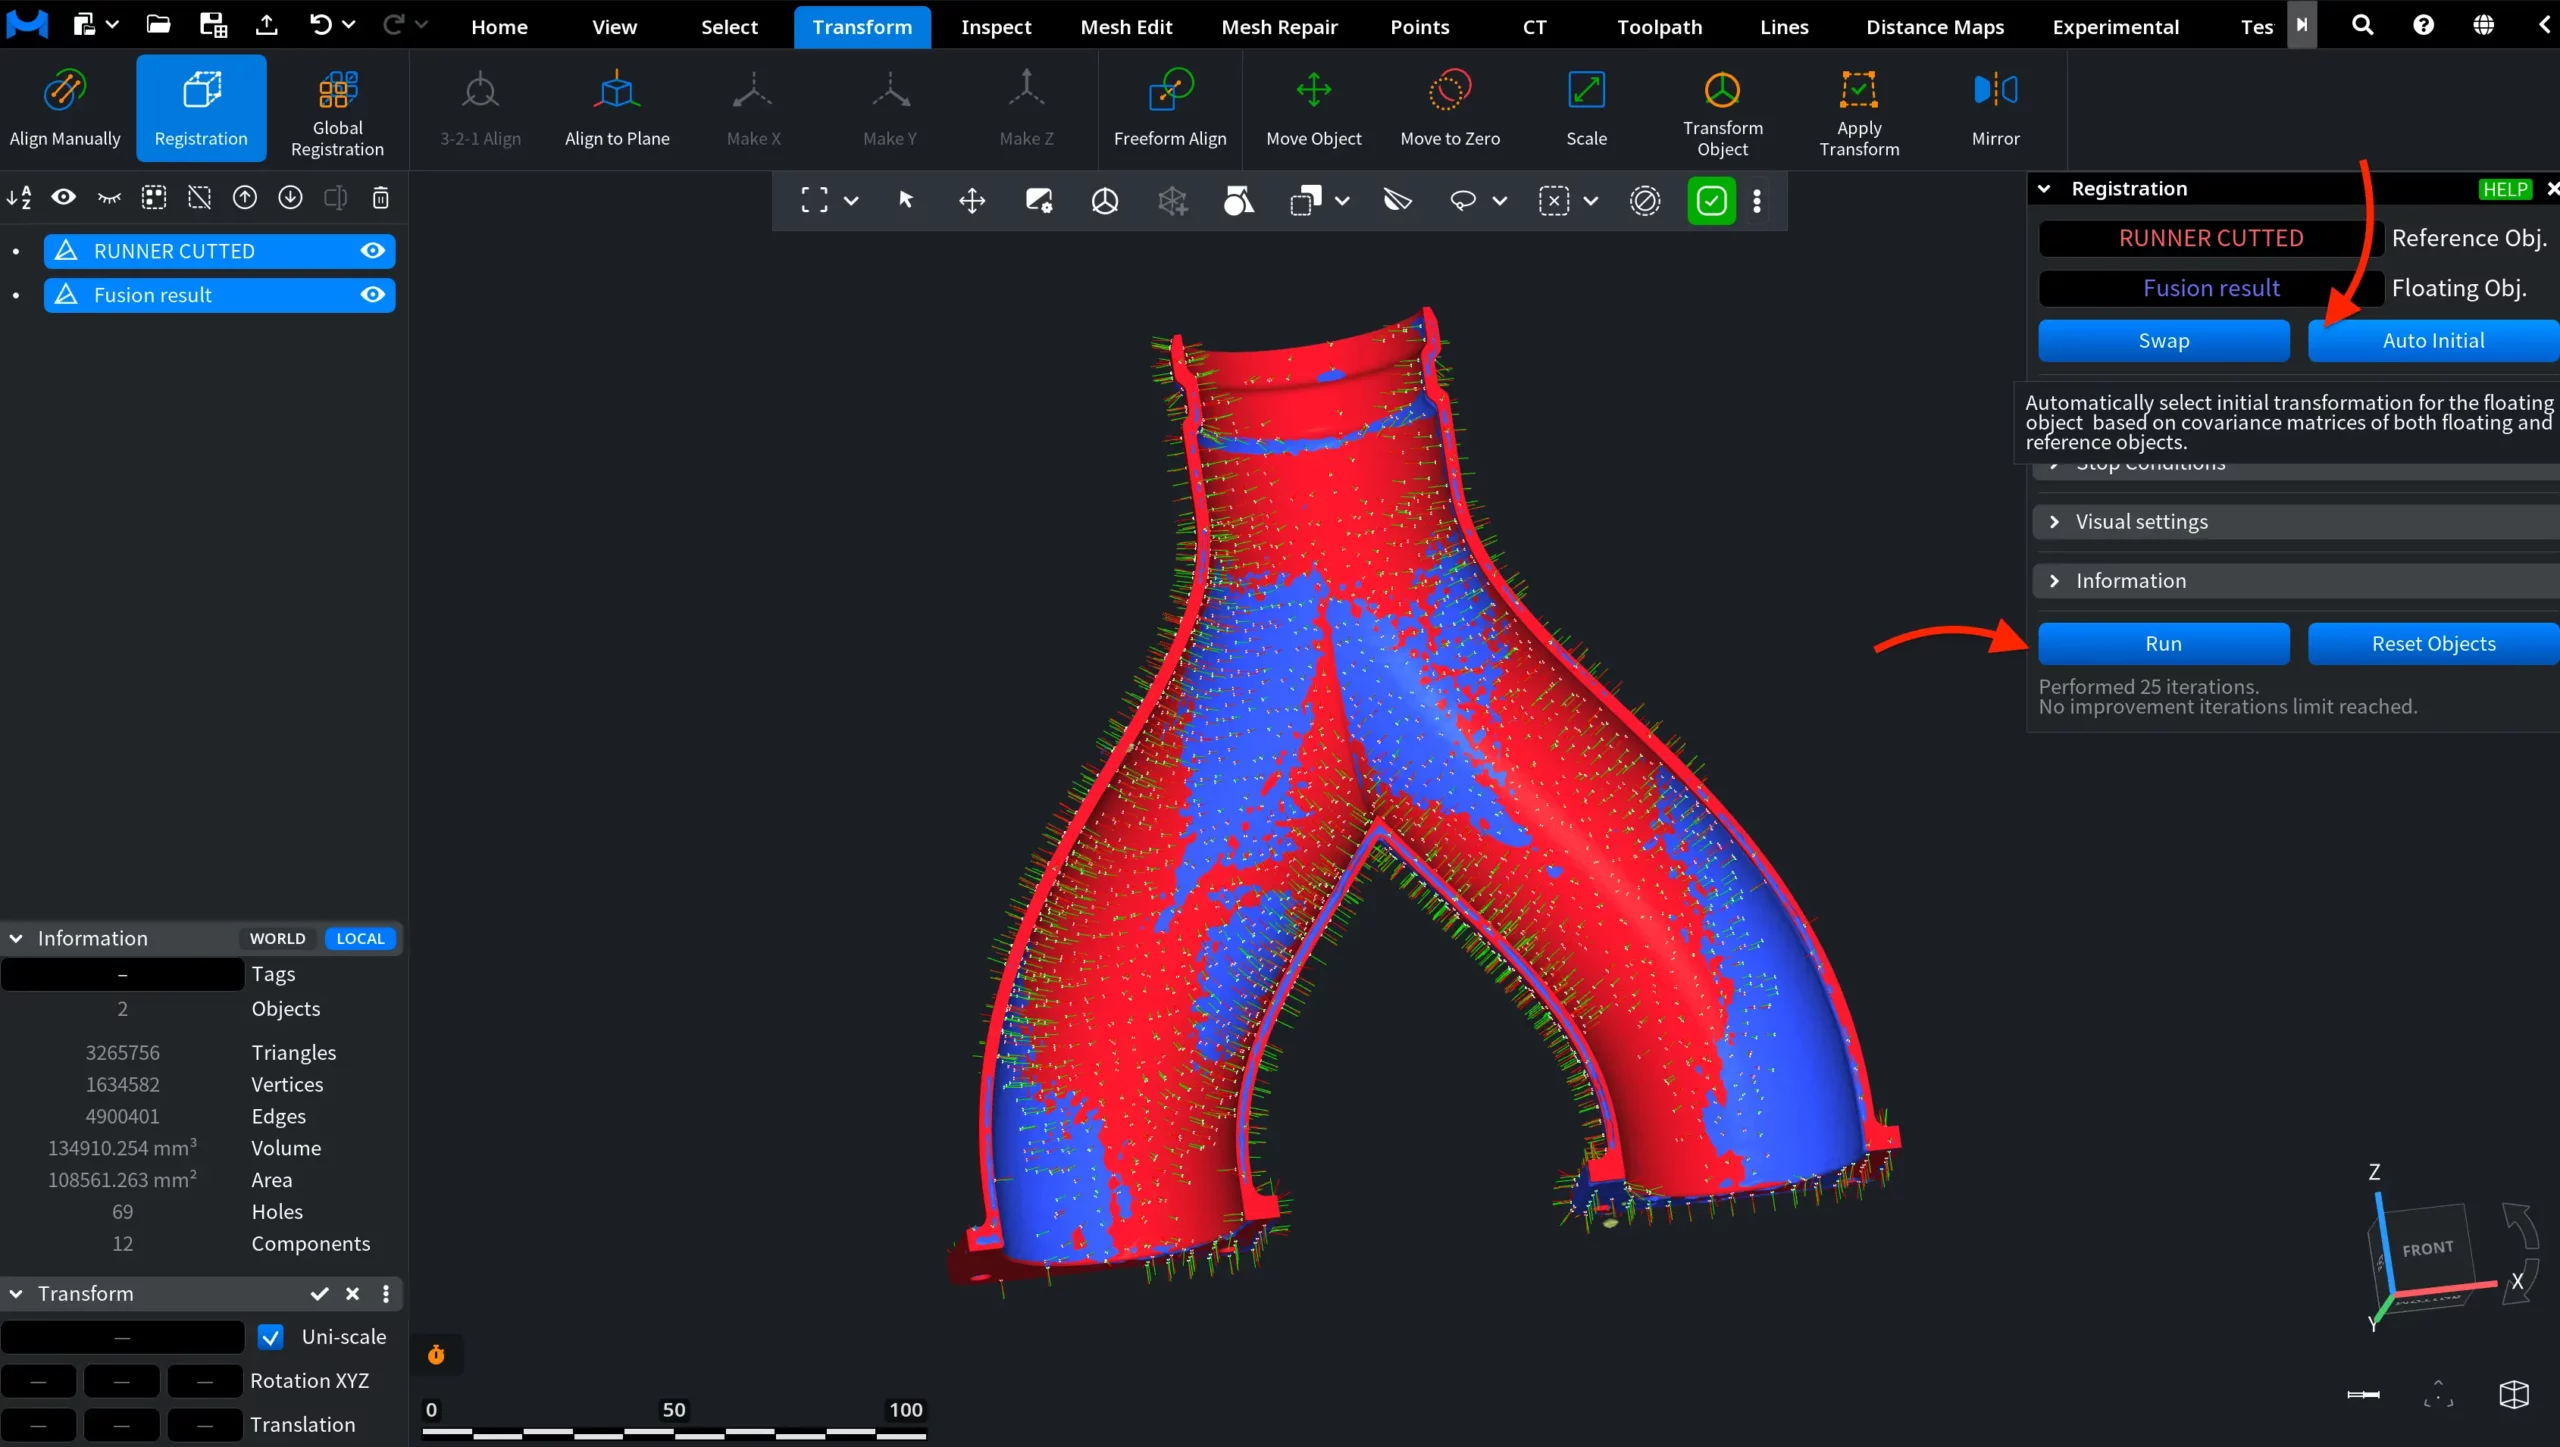
Quality Report: Registration. After

Step 2. Surface Deviation

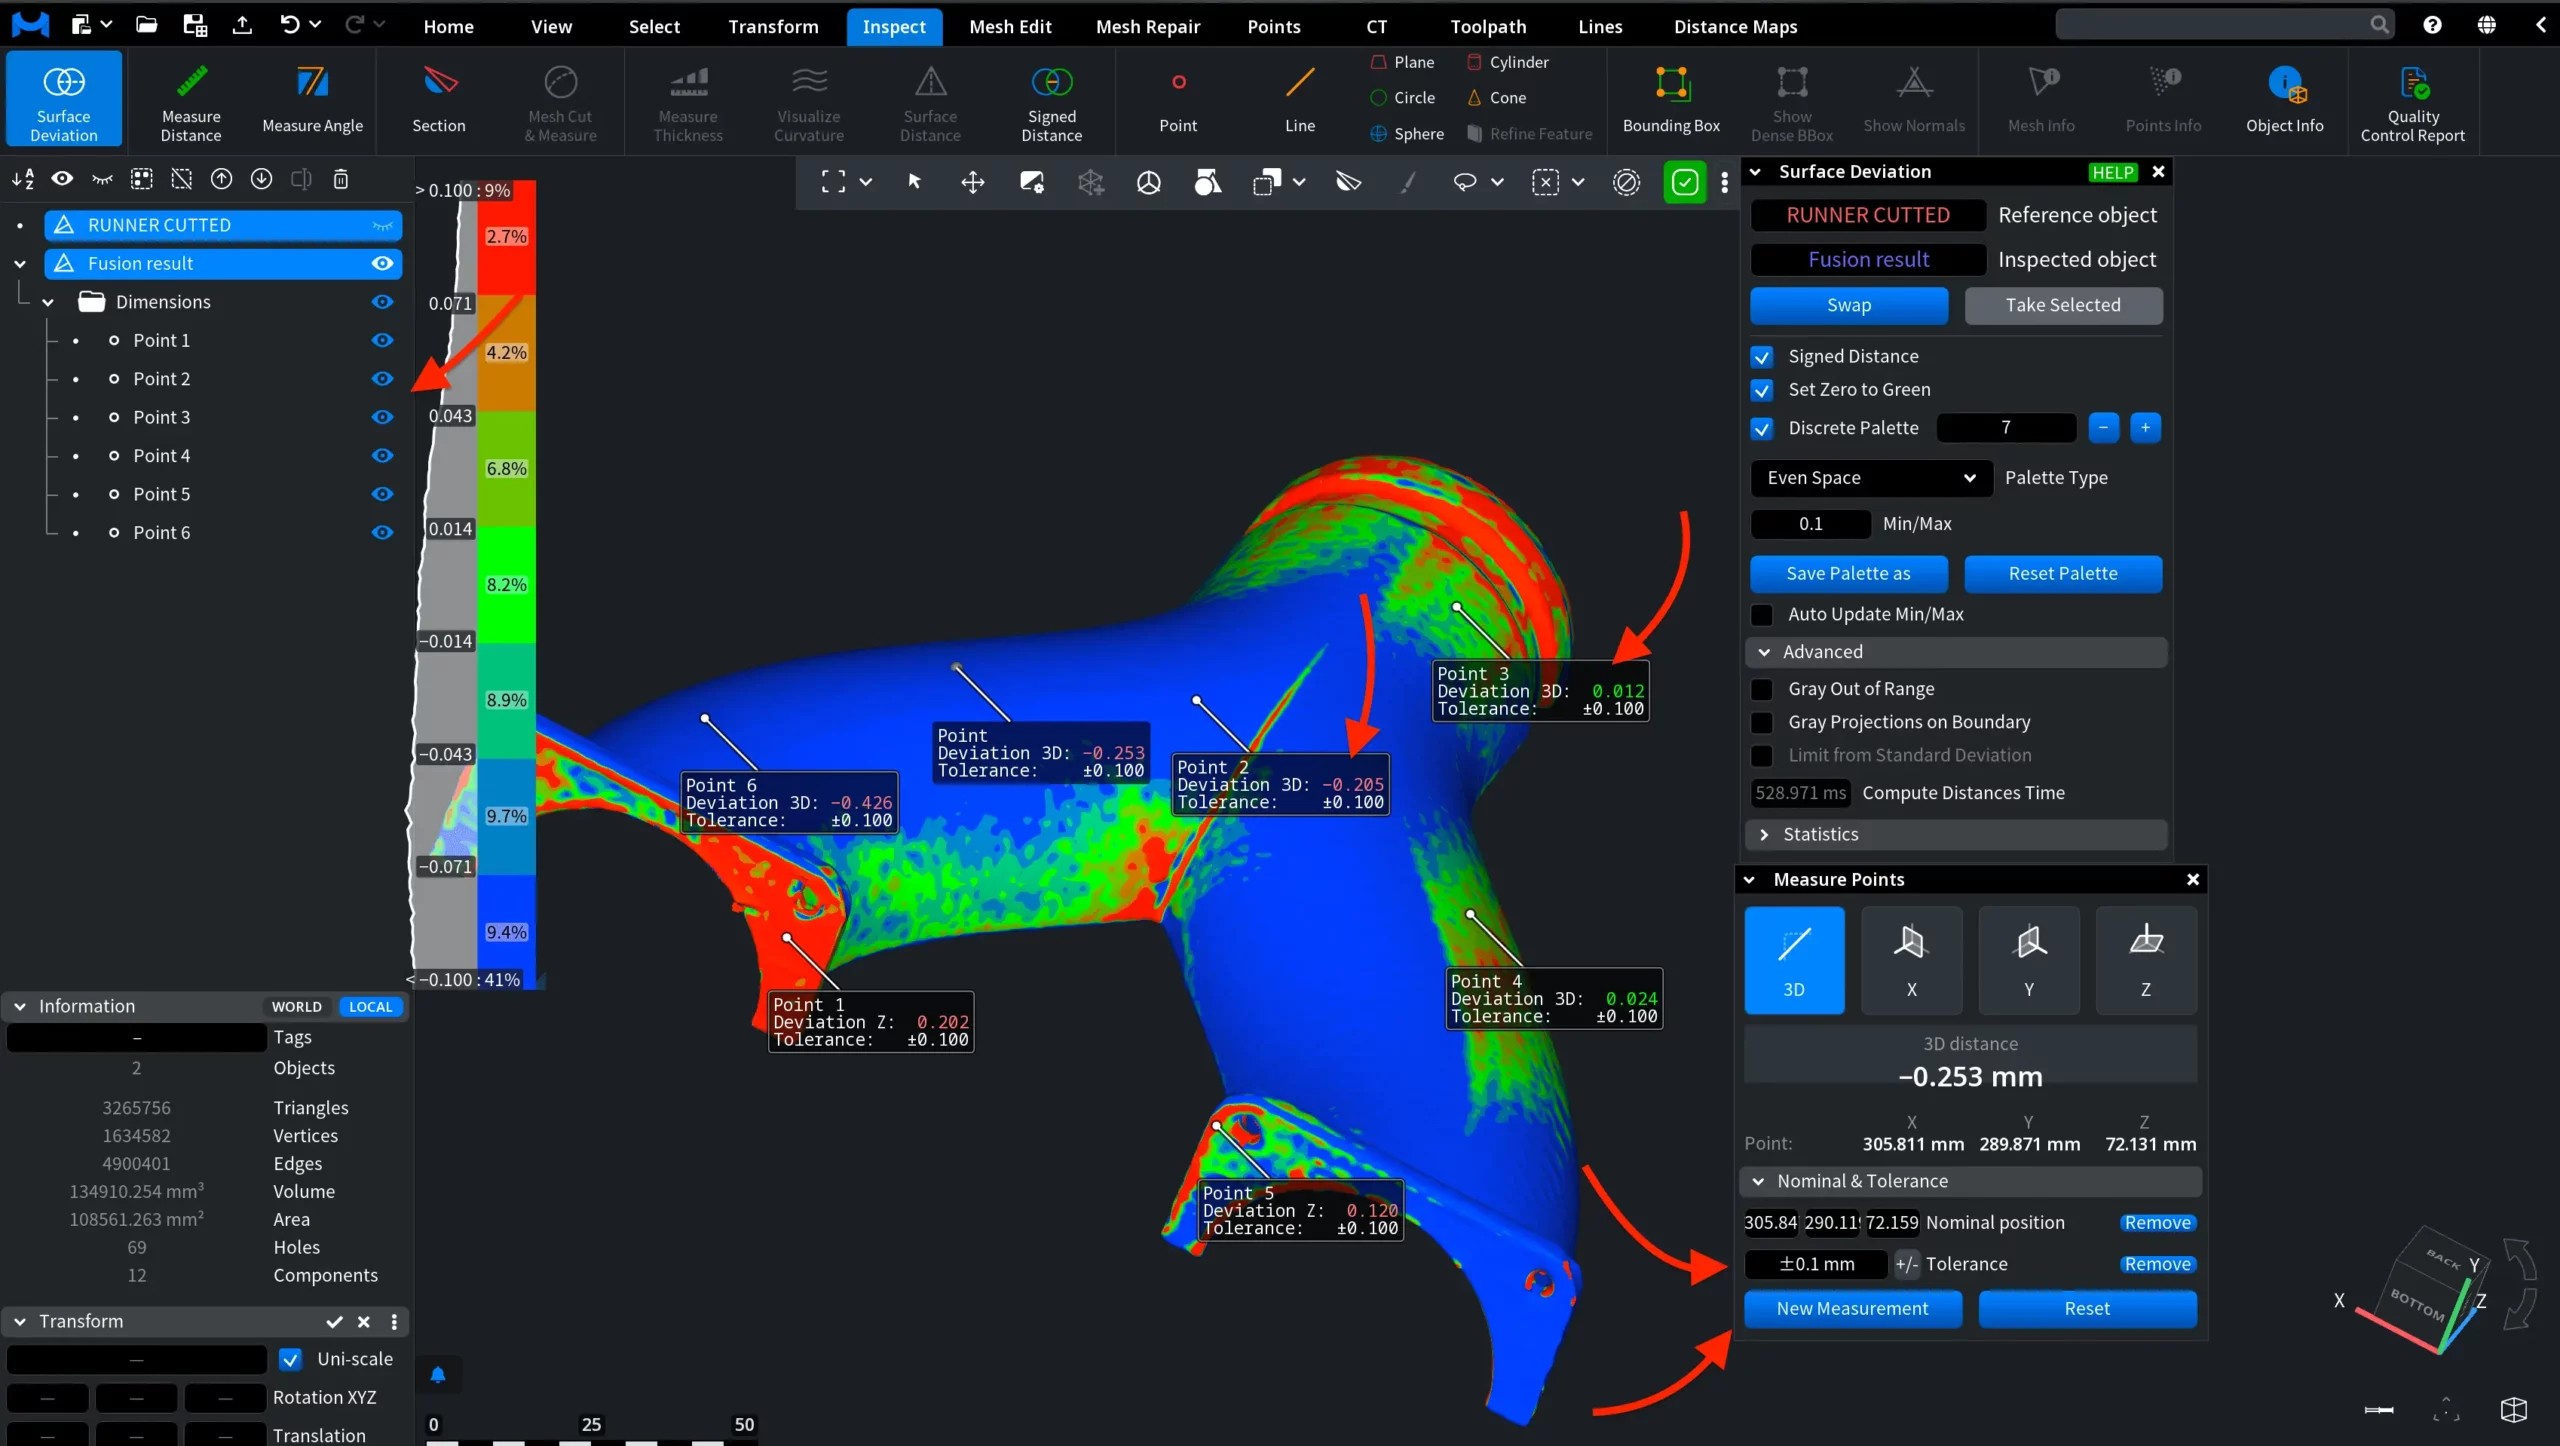
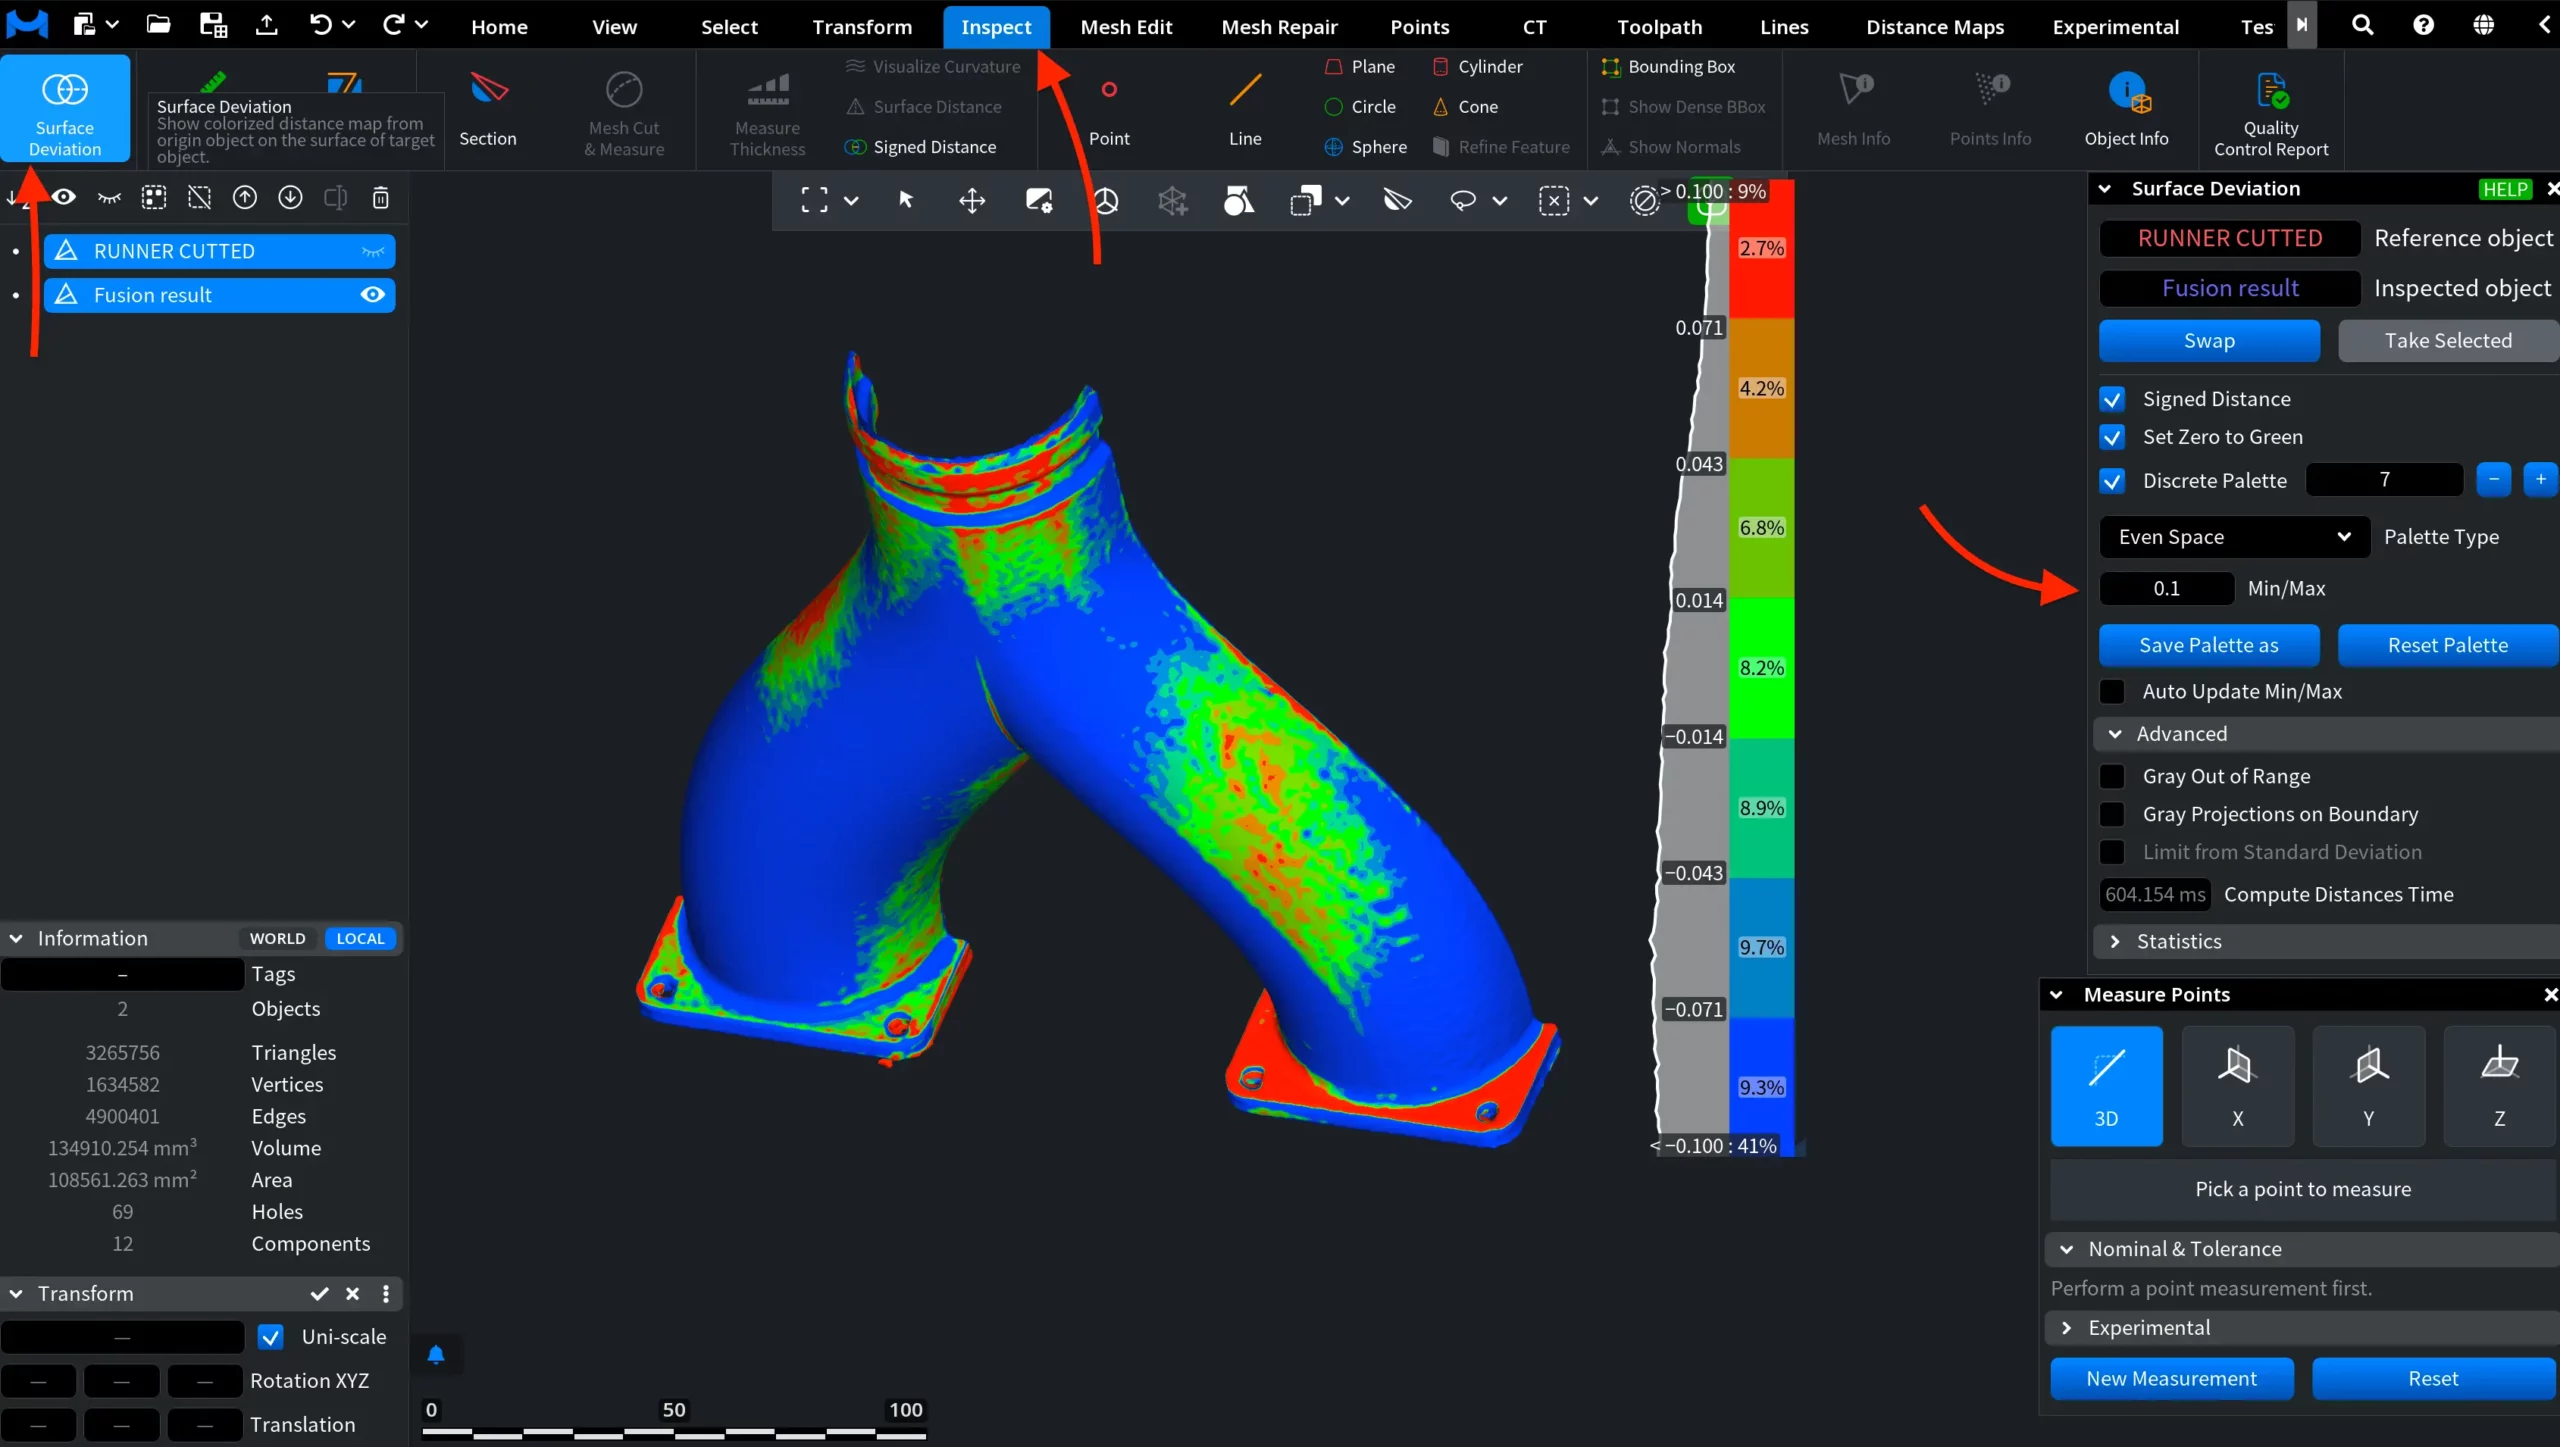
Next, we need to visualize the deviation between the scan and the CAD file. To do this, we go to the Inspect tab and click Surface Deviation. This tool shows the distance map from one object to another, making it easier to see where the scanned model differs from the source CAD geometry. In this scenario, we set the minimum and maximum deviation to 0.1 mm in the Min/Max field. This defines the deviation range shown on the color scale.

Quality Report: Surface Deviation

The color bar shows both the direction and amount of deviation. Red areas represent positive deviation from the CAD reference, while blue areas represent negative deviation. Green areas represent regions with minimal or no deviation.

Step 3. Measure Points

When you click Surface Deviation, the Measure Points panel opens together with the Surface Deviation panel. In this mode, you can click points on the mesh to analyze deviation in specific areas.

For this assessment, make sure to set the Tolerance value for each measurement point. In our example, the tolerance is set to 0.1 mm.

After selecting a point, set its tolerance value and click New Measurement to add the next point. Repeat this process for all areas you want to inspect.

Once a Tolerance value is assigned, the Deviation value changes color depending on whether the point is within or outside the tolerance range. Green indicates that the point is within the allowed tolerance. Red indicates that the deviation is outside the allowed tolerance, meaning there is either too much or too little material in that area.

Each measured point appears in the Scene Tree under Dimensions and has its own 3D Deviation value.


Step 4. Report Generation

Finally, under the Inspect tab, you can find the Quality Control Report tool. This tool generates a quality control report as a PDF file based on the current inspection data, including the surface deviation map and measured points. After checking the deviation results and adding the necessary measurement points, click Quality Control Report to proceed with report generation.

Quality Control Report: Where to Find

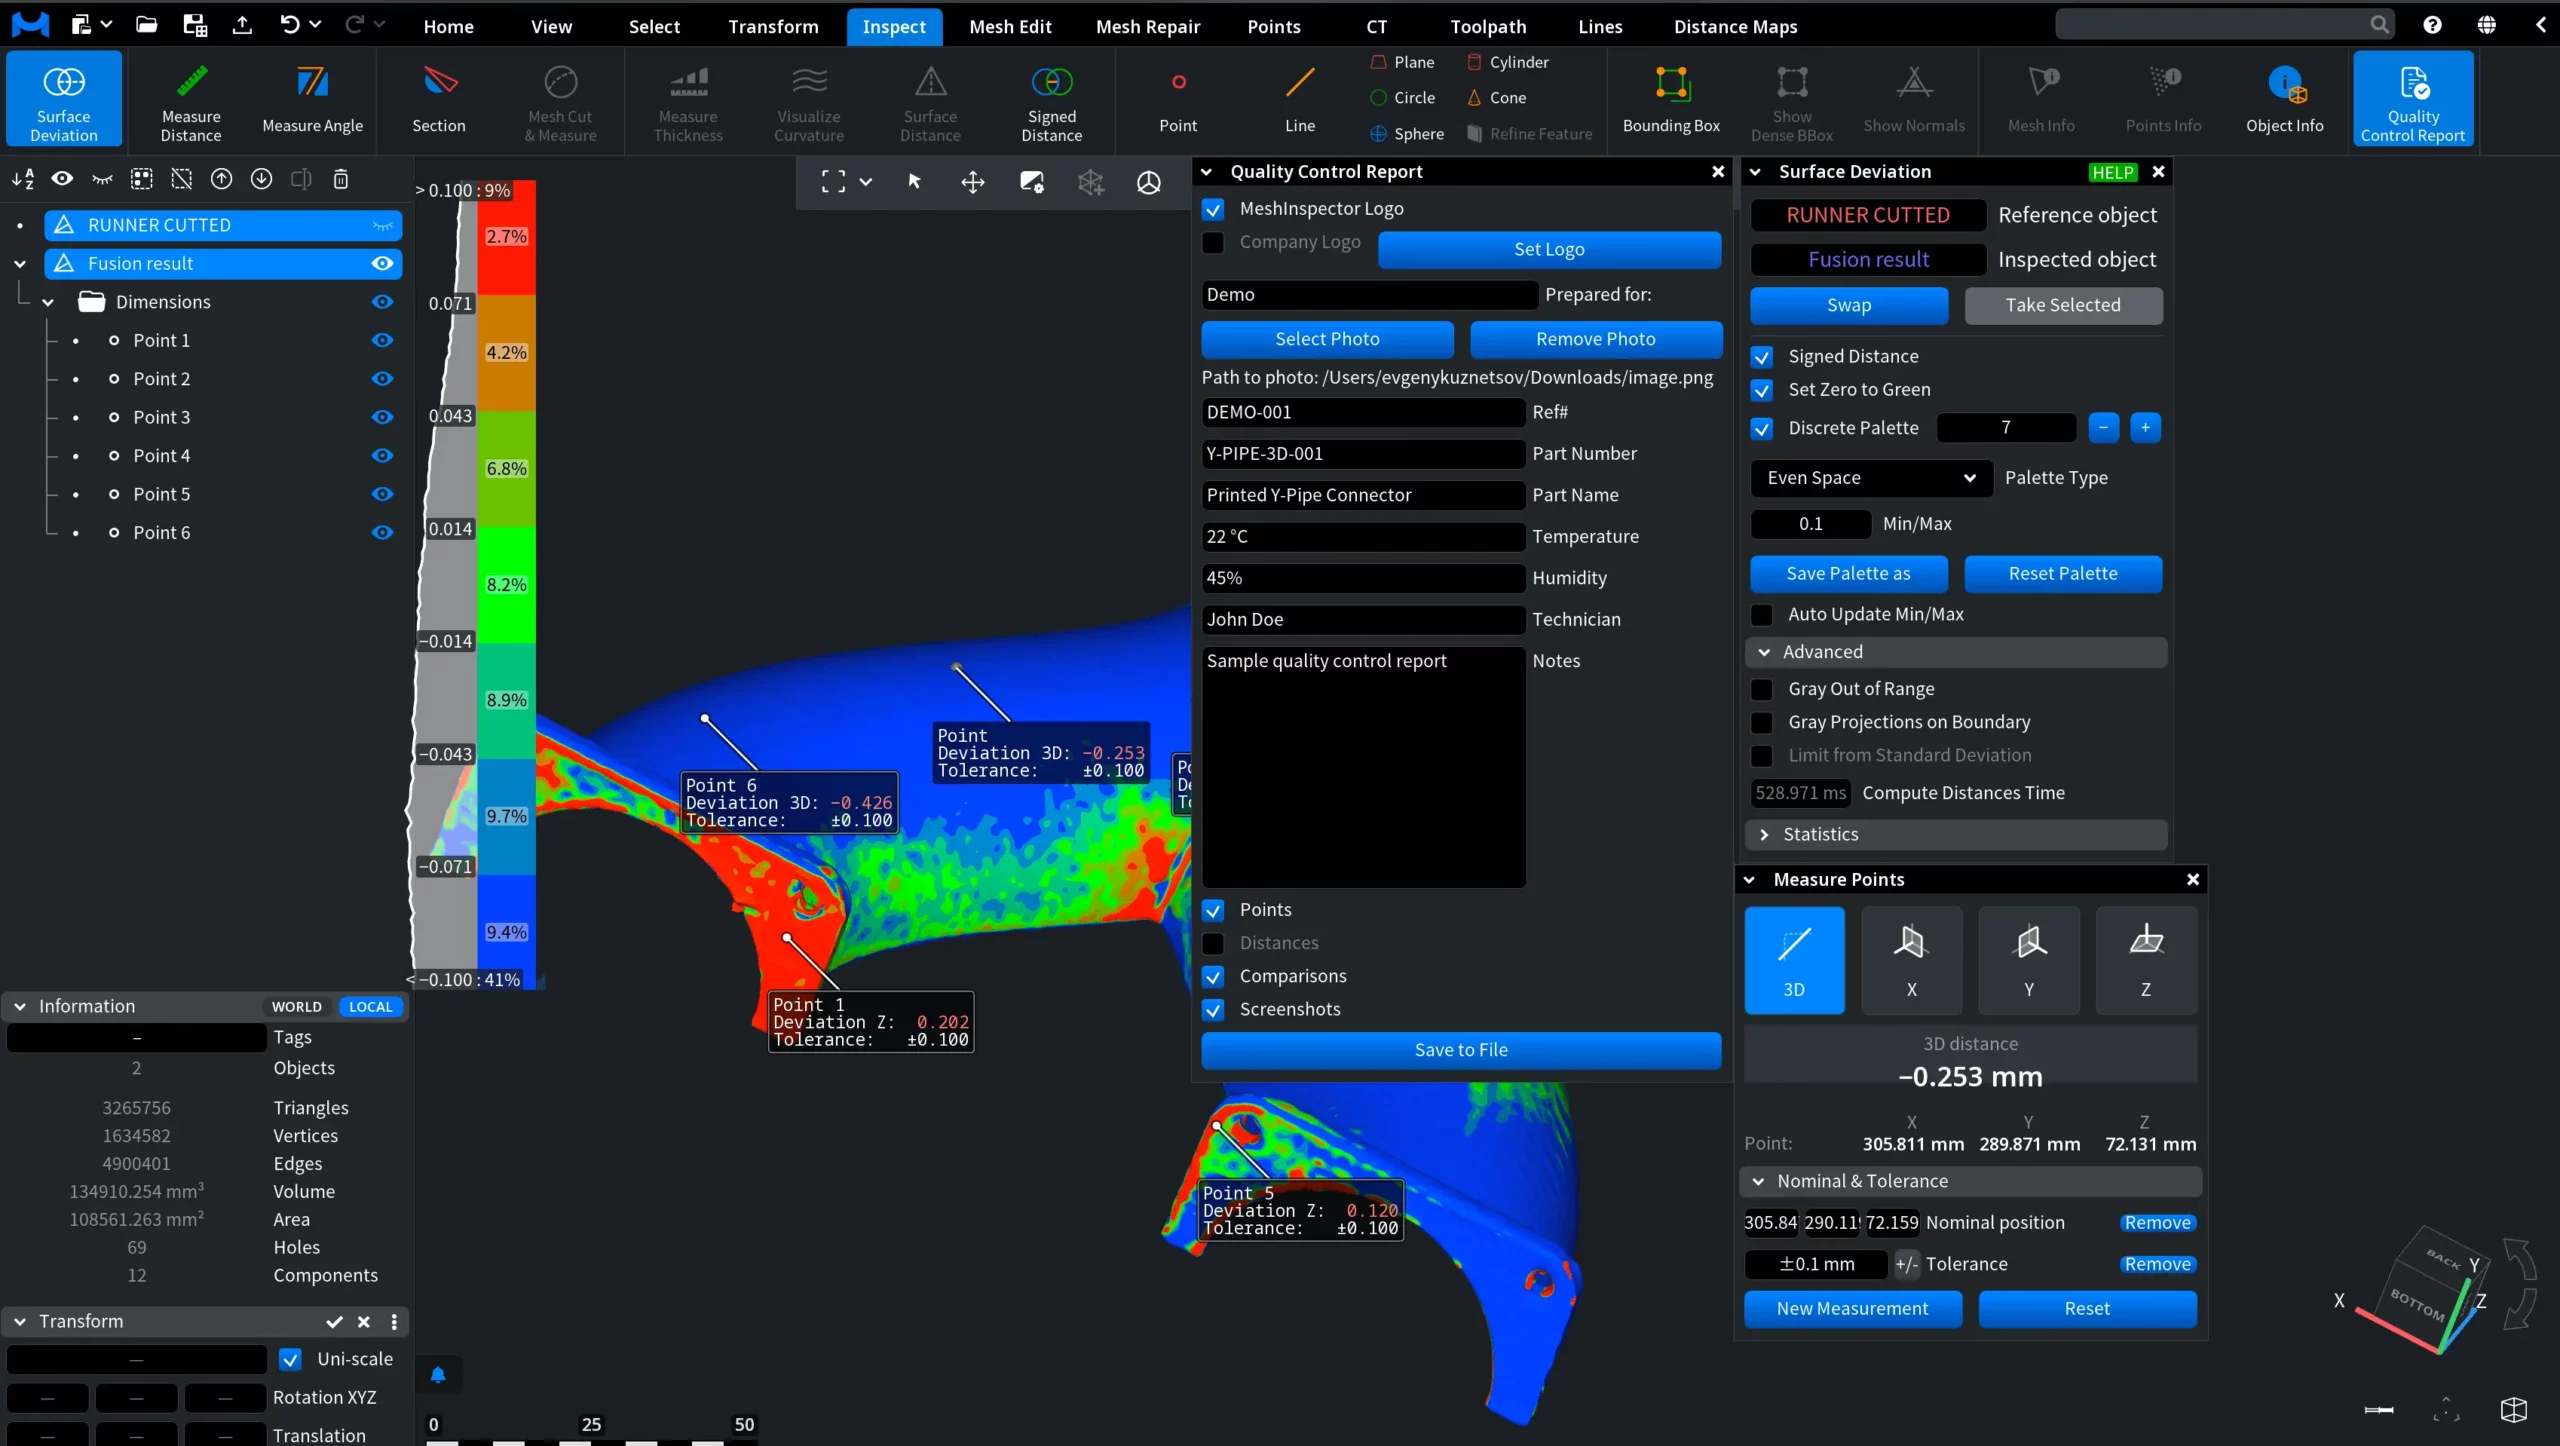
After clicking Quality Control Report, a dedicated panel opens on the right side of the workspace. Here, you can configure what information will be included in the final PDF report.

You can keep the MeshInspector Logo, add a Company Logo, and upload a photo of the inspected part using Select Photo. The panel also lets you fill in report details, such as Prepared for, Ref#, Part Number, Part Name, Temperature, Humidity, Technician, and Notes. At the bottom of the panel, choose which sections to include in the report. In this example, we include Points, Comparisons, and Screenshots. Once everything is ready, click Save to File to generate the PDF report.

Quality Control Report: Panel

MeshInspector then opens a file dialog where you can choose the folder and file name for the PDF report.

Step 5. Reviewing the Generated Report

After you save the report, MeshInspector generates a PDF file with the selected inspection data. In our example, the report includes the uploaded part photo, general report details, measured points, comparison statistics, and screenshots of the inspected model from different views.

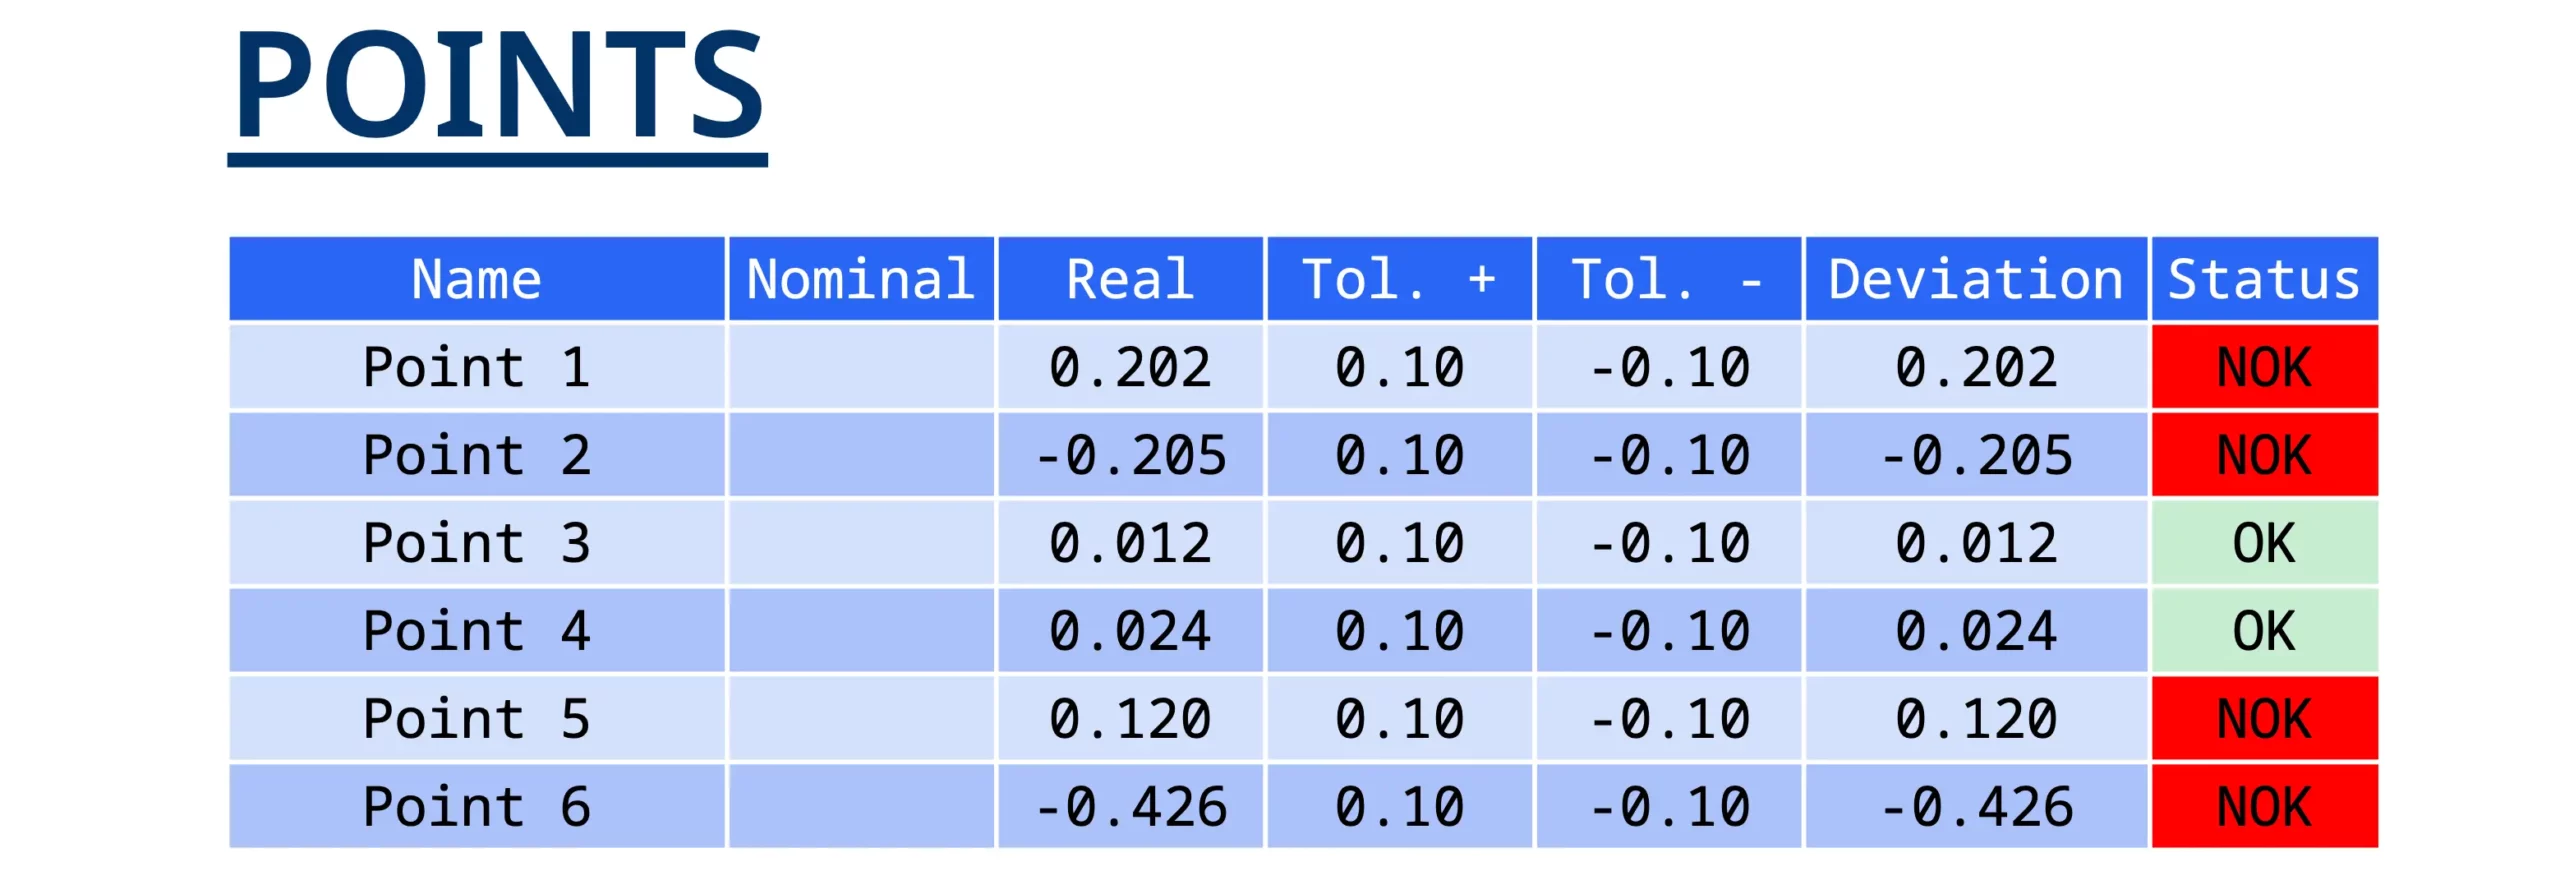
The Points section lists all measurement points added during the inspection. For each point, the report shows the measured deviation, the positive and negative tolerance limits, the final deviation value, and the status. Points that fall within the specified tolerance are marked as OK. Points that exceed the tolerance are marked as NOK.

Quality Control Report: Page with Points

The Comparisons section summarizes the overall deviation between the scan and the CAD reference. It includes minimum and maximum distance, average signed distance, average absolute distance, and standard deviation values. It also shows how much of the inspected surface falls into each color-coded deviation range.

The final pages contain screenshots of the model from different views, such as front, back, left, right, top, and bottom. These screenshots help document where the main deviations are located on the inspected part and make the report easier to review or share with other stakeholders.

How to Prepare and Generate a Quality Control Report in MeshInspector

Table Of Contents