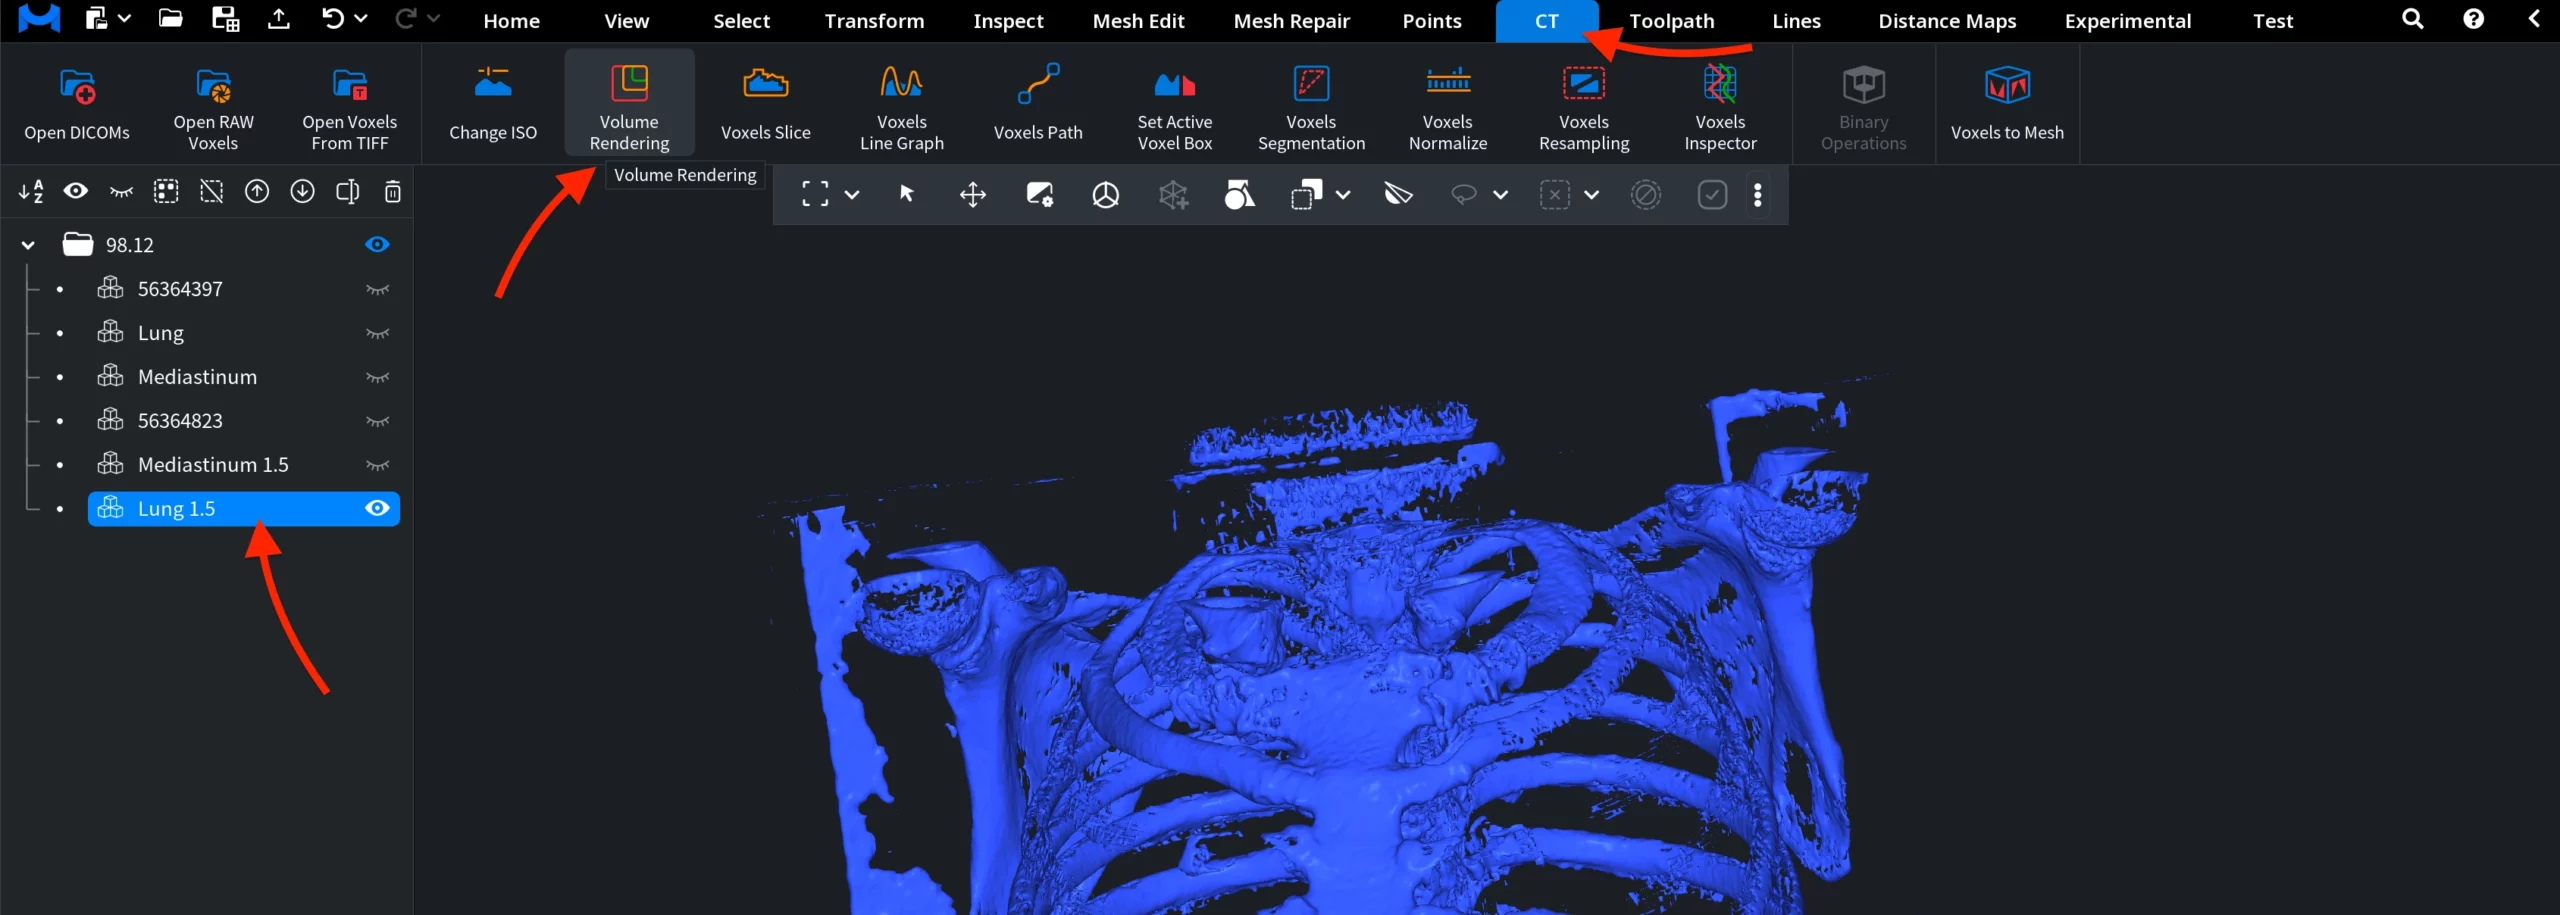
When working with voxel data, the model is often displayed as an iso-surface. That is, only a single surface extracted from the voxel volume is visible. While this representation is useful for generating meshes, it hides many internal structures present in the voxel data. MeshInspector provides the Volume Rendering tool to visualize the entire voxel volume, including internal structures that are not visible in the iso-surface representation. To find this tool, open the CT tab on the top toolbar and click Volume Rendering. The Volume Rendering tool becomes active only when a single voxel volume is selected.
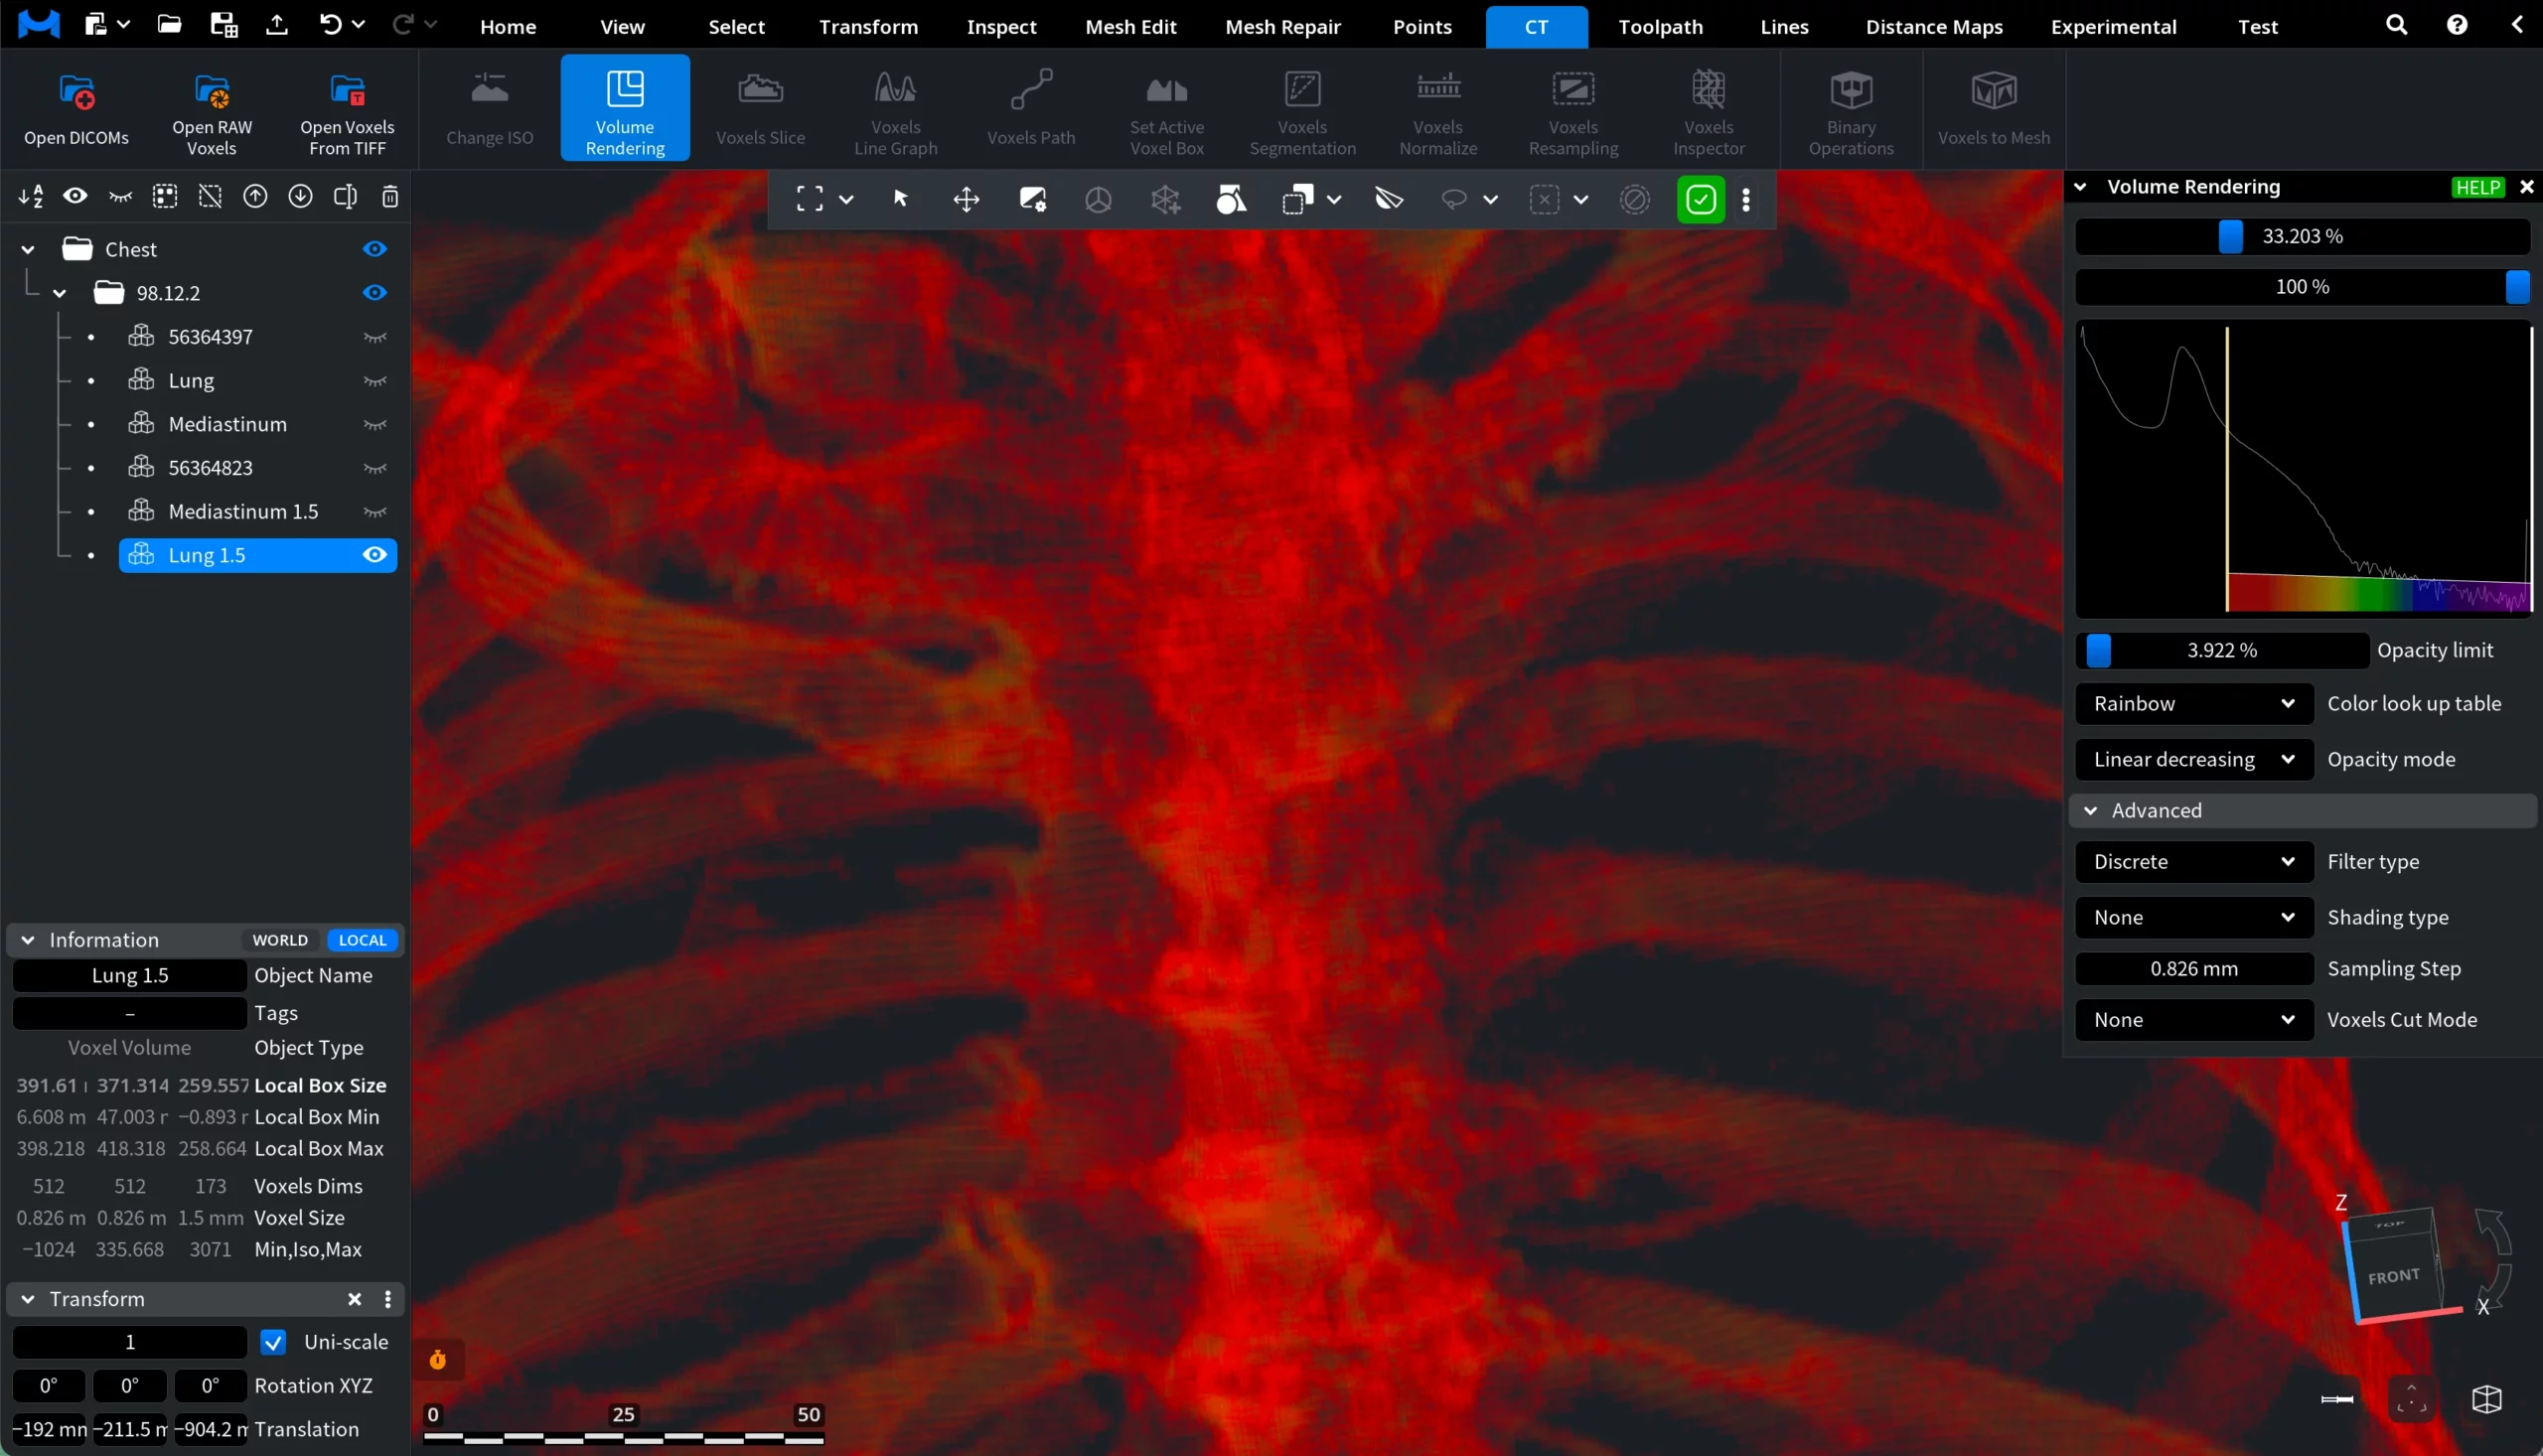
Clicking Volume Rendering changes the way the voxel volume is displayed. Instead of showing an iso-surface, MeshInspector switches to volumetric visualization using the default rendering settings. At the same time, a dedicated Volume Rendering panel appears on the right side of the interface. This panel contains the controls used to adjust how the voxel data is visualized.
Volume Rendering Settings
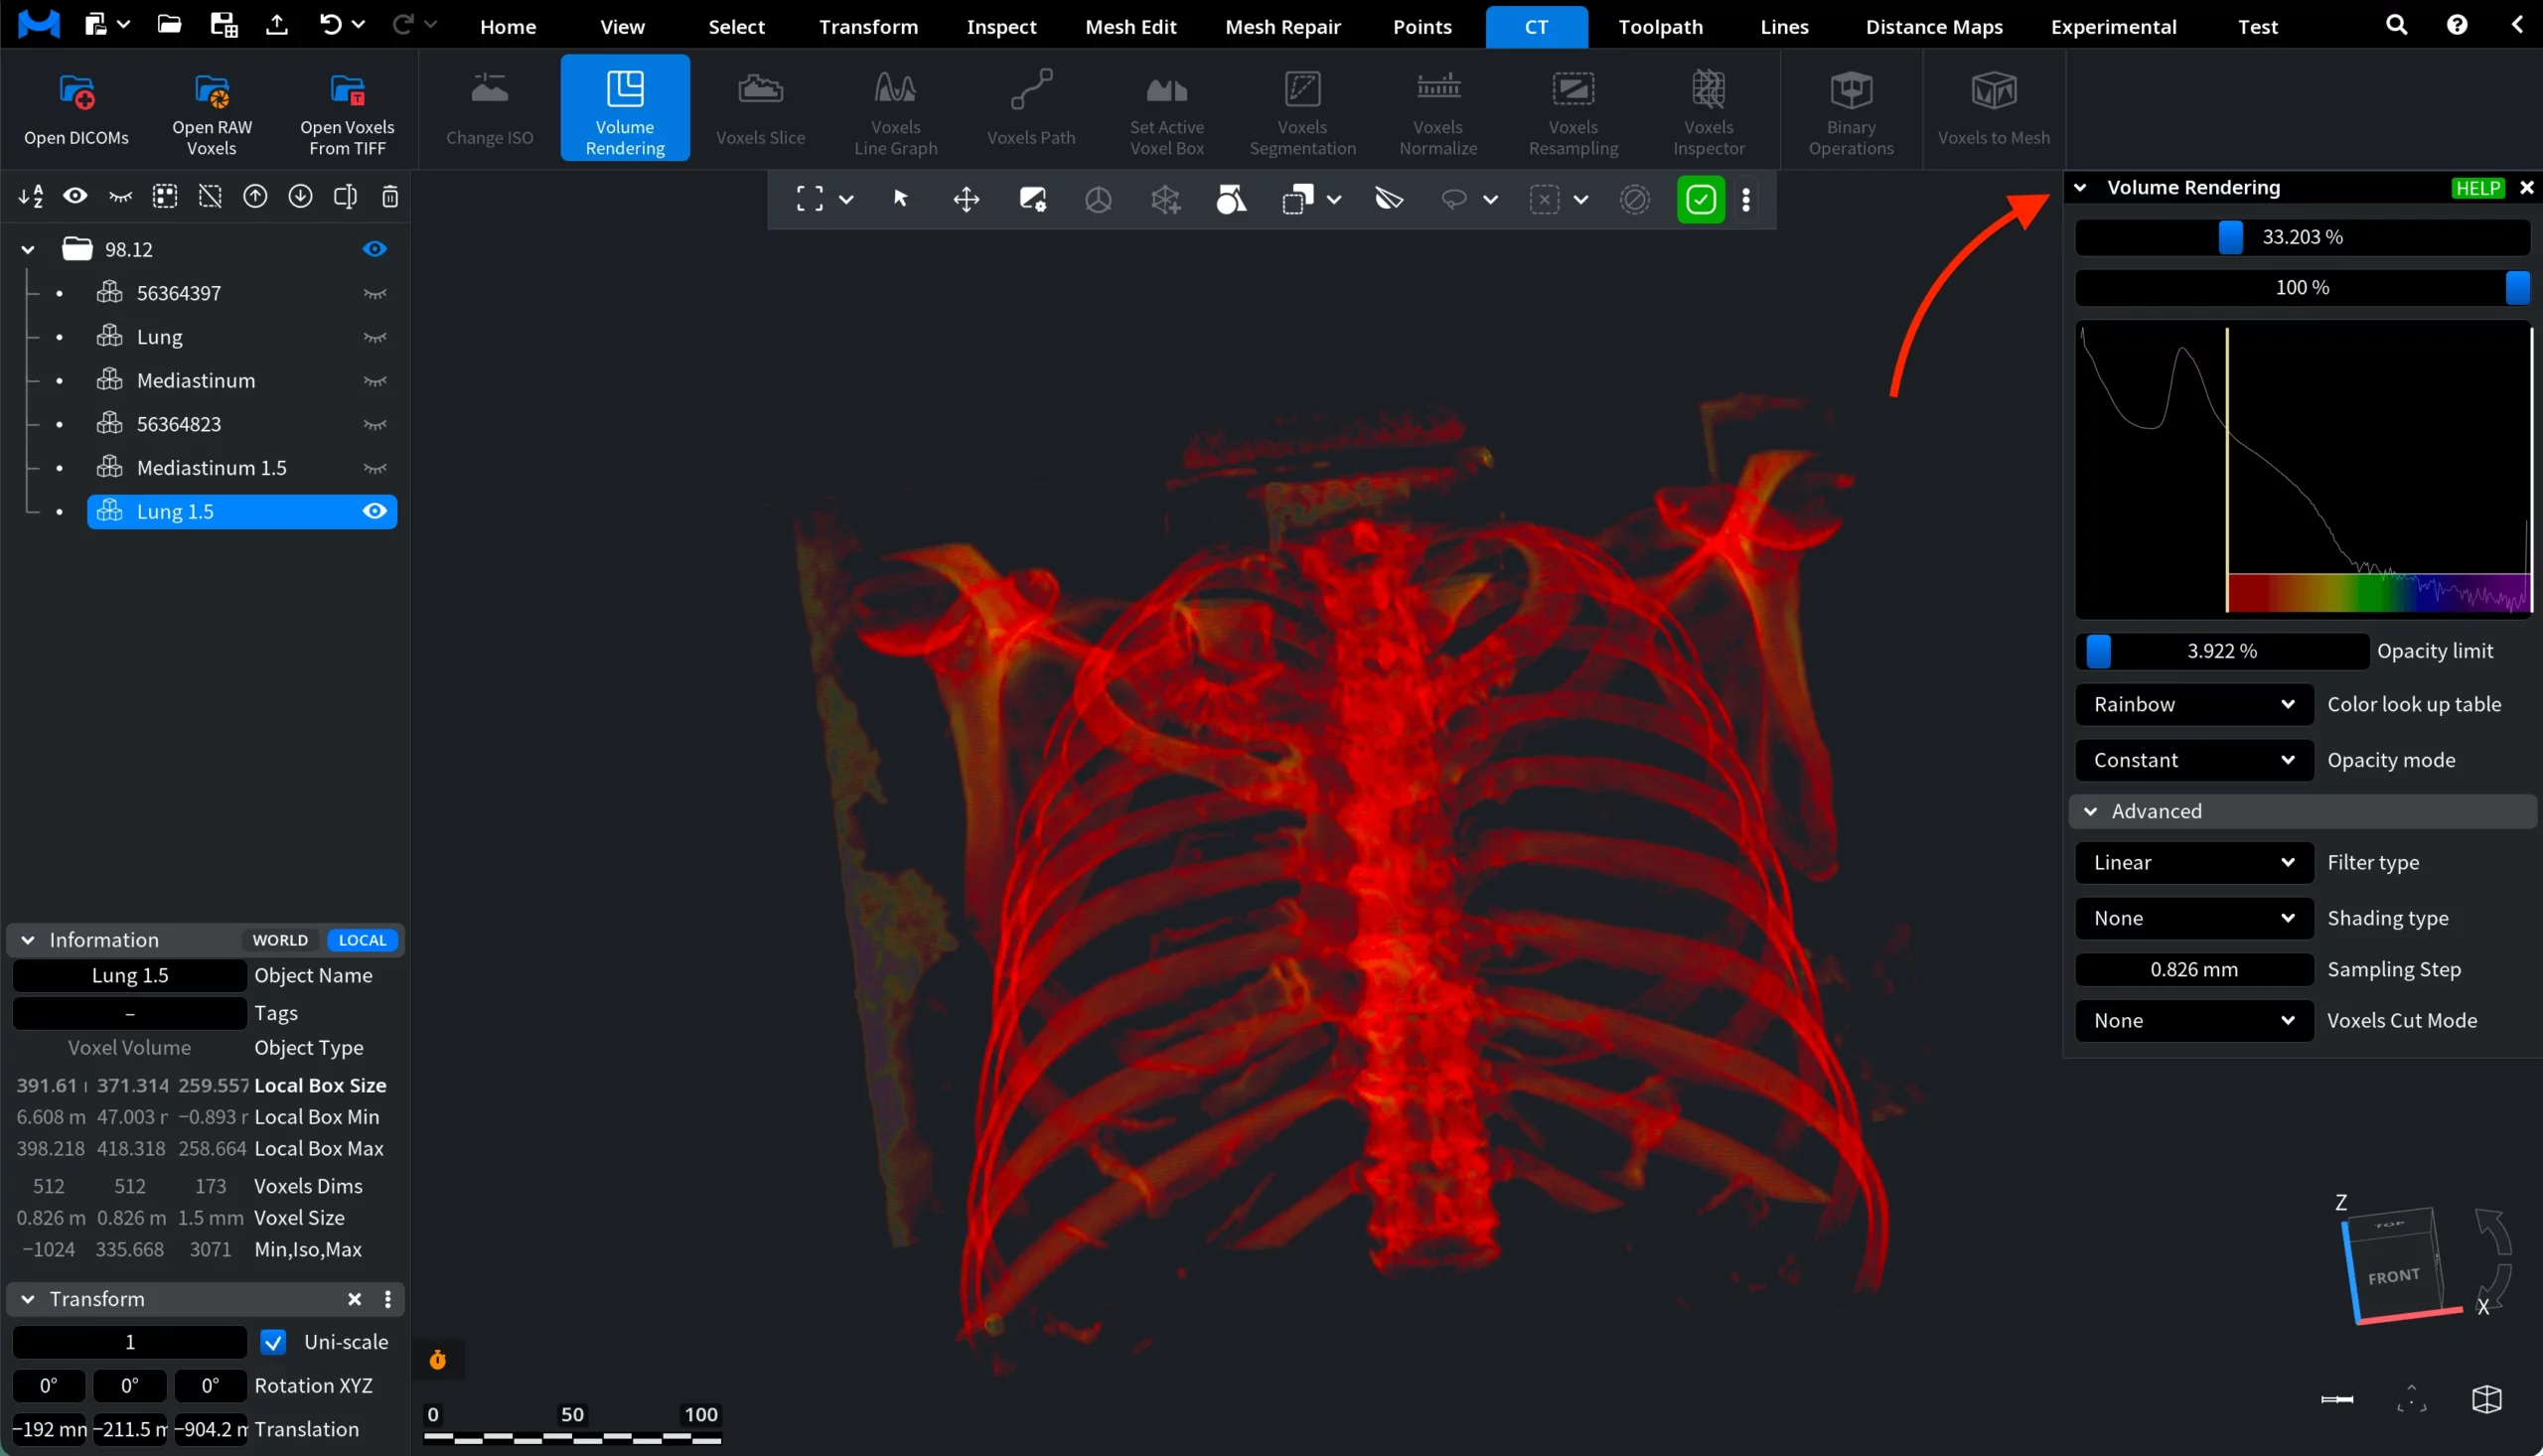
The top slider defines the minimum voxel intensity used for volume rendering. Voxels with values lower than this minimum threshold become transparent, allowing you to remove low-density regions from the visualization. This helps reduce background noise and makes higher-density structures easier to observe. The value can also be entered manually by pressing Command + Left Mouse Button, which allows you to type the value from the keyboard.
The second slider defines the maximum voxel intensity used for rendering. Voxels with values higher than this maximum threshold become transparent. Adjusting this parameter allows you to hide extremely dense regions and focus on a specific intensity range within the voxel volume. As with the minimum value, you can press Command + Left Mouse Button to enter the value manually.
The histogram displays the distribution of voxel intensity values within the voxel volume. The horizontal axis represents the voxel intensity range, while the curve shows how many voxels fall into each intensity interval. Peaks in the histogram indicate ranges where many voxels share similar intensity values. This visualization helps you understand how density values are distributed in the dataset and assists in selecting appropriate minimum and maximum intensity thresholds for volume rendering.
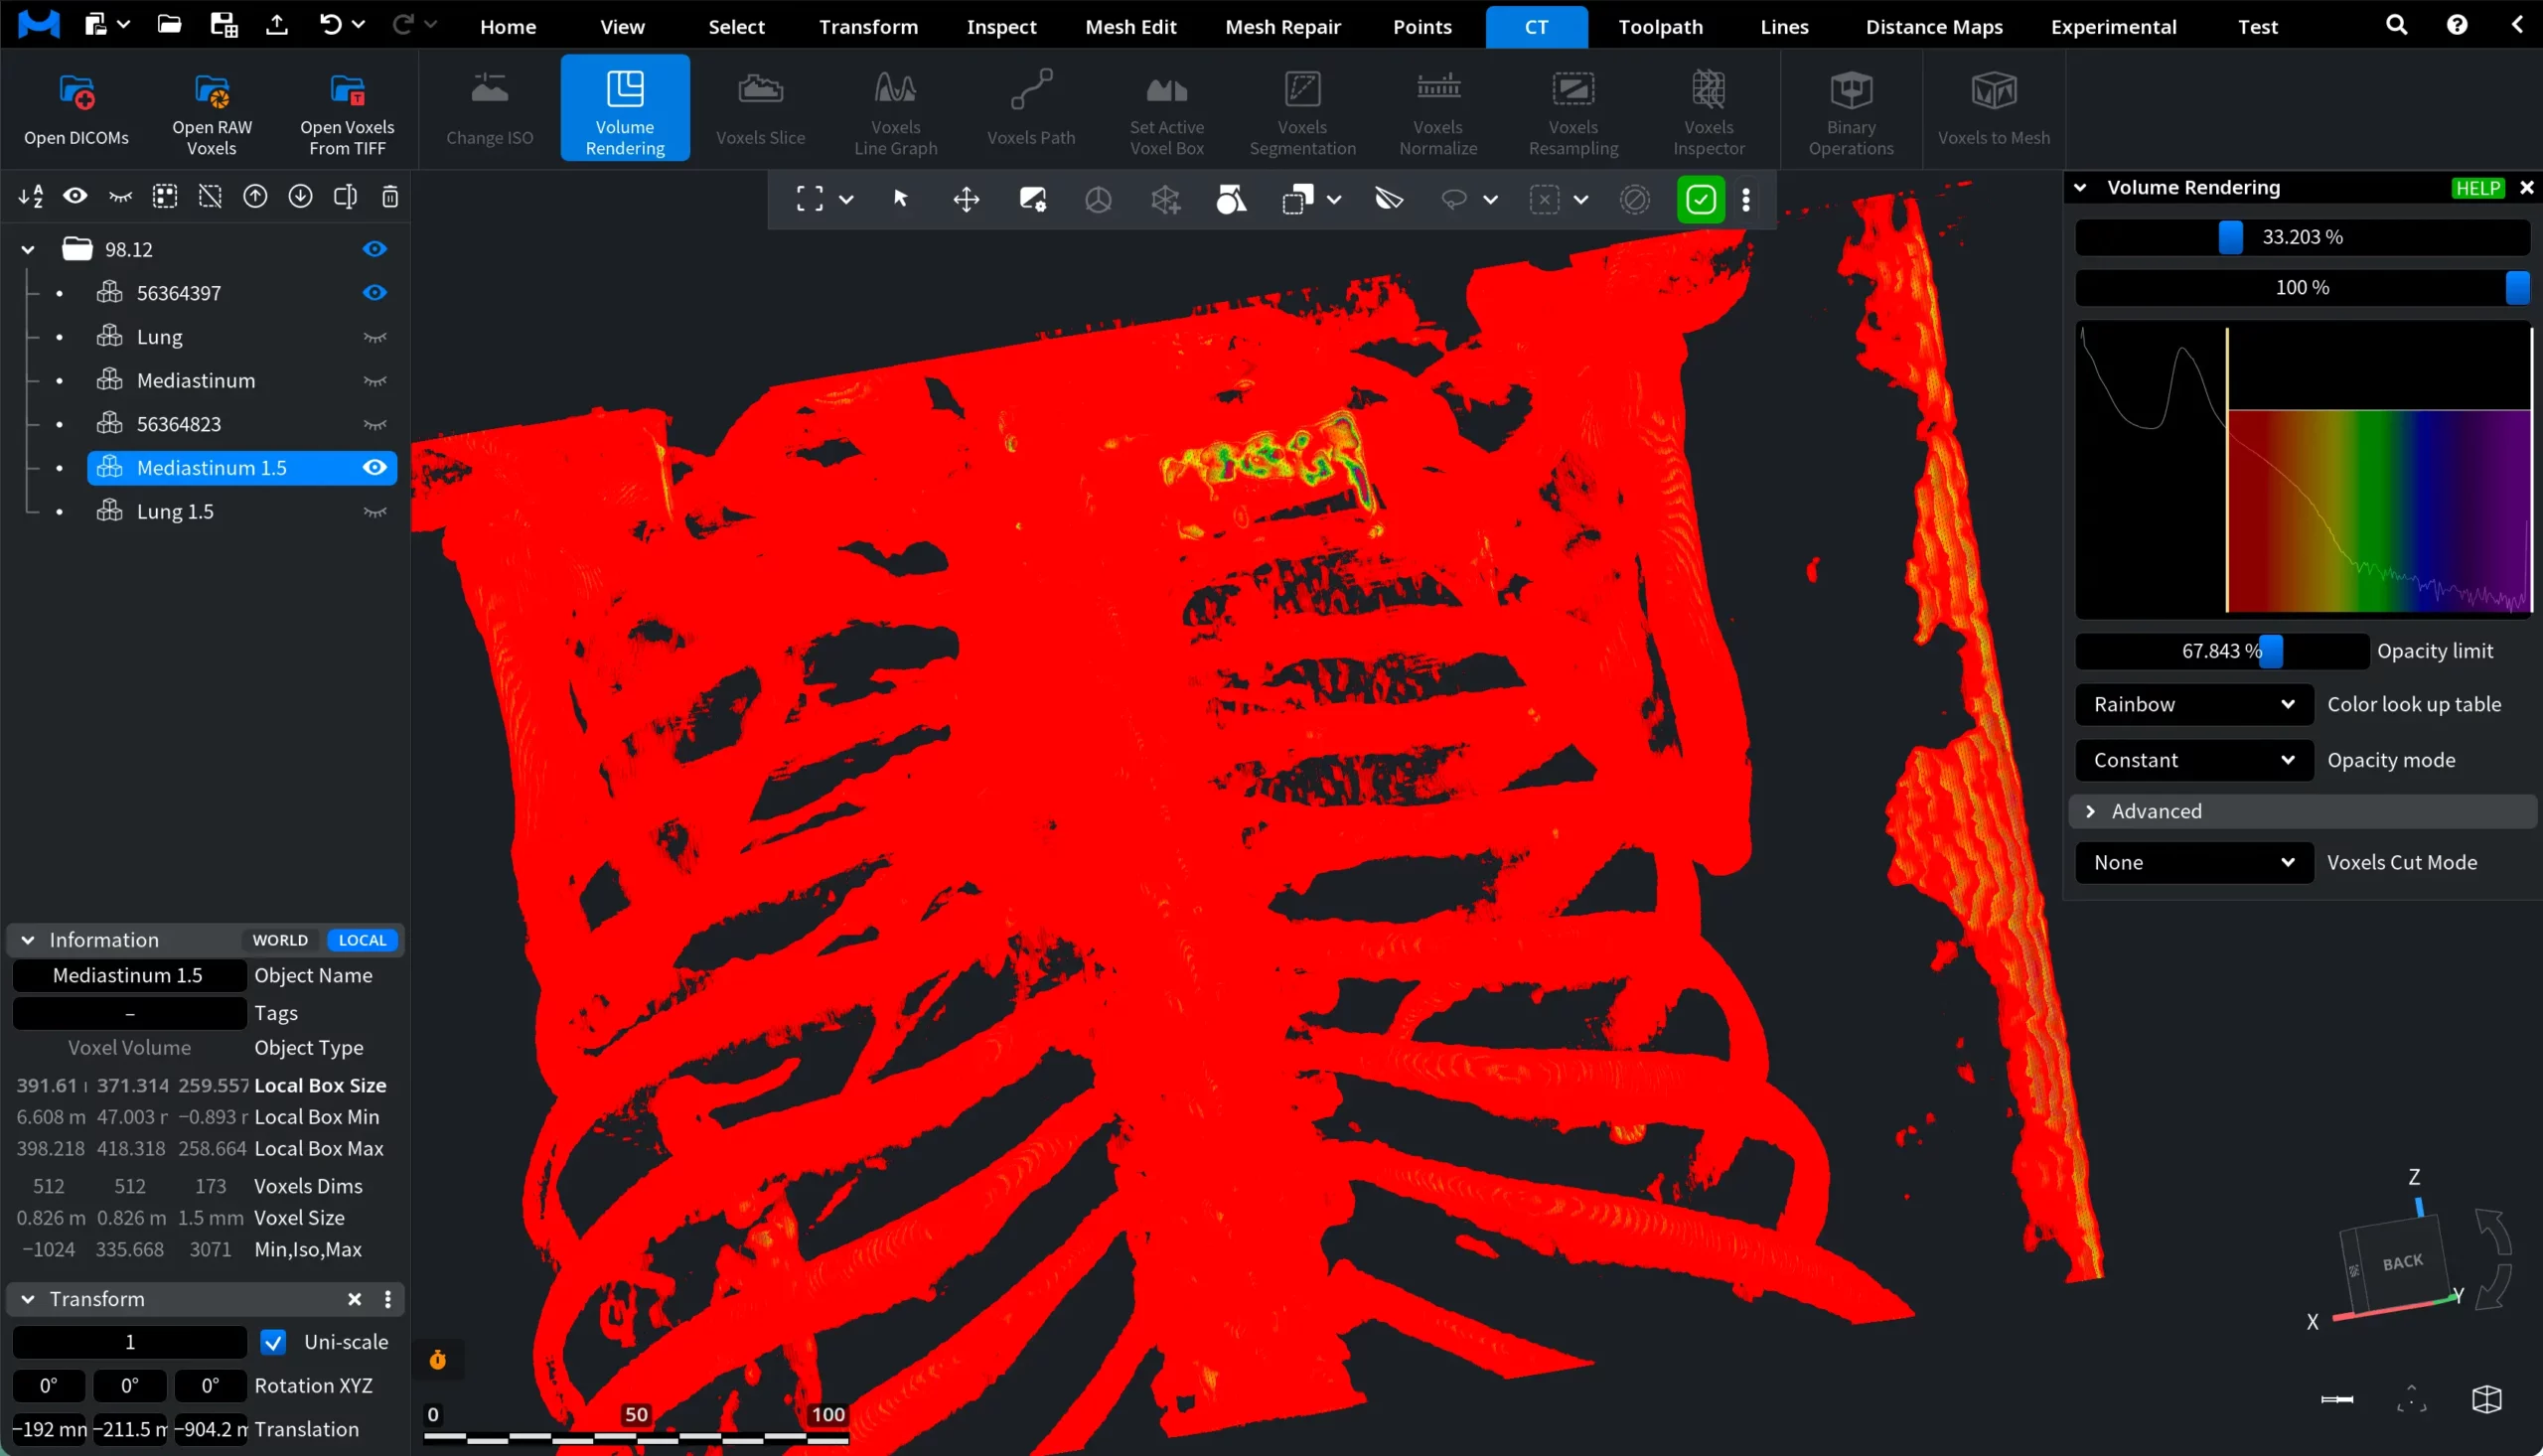
Opacity limit controls the maximum opacity applied to voxels within the selected intensity range. Lower values make the rendered volume more transparent, allowing deeper internal structures to become visible. Higher values increase the opacity of voxels, making the rendered structures appear denser and less transparent.
Color look up table defines how voxel intensity values are mapped to colors in the volume rendering. Different lookup tables apply different color schemes to the voxel data. This allows you to emphasize structures with different density levels and improve visual interpretation of the volume:
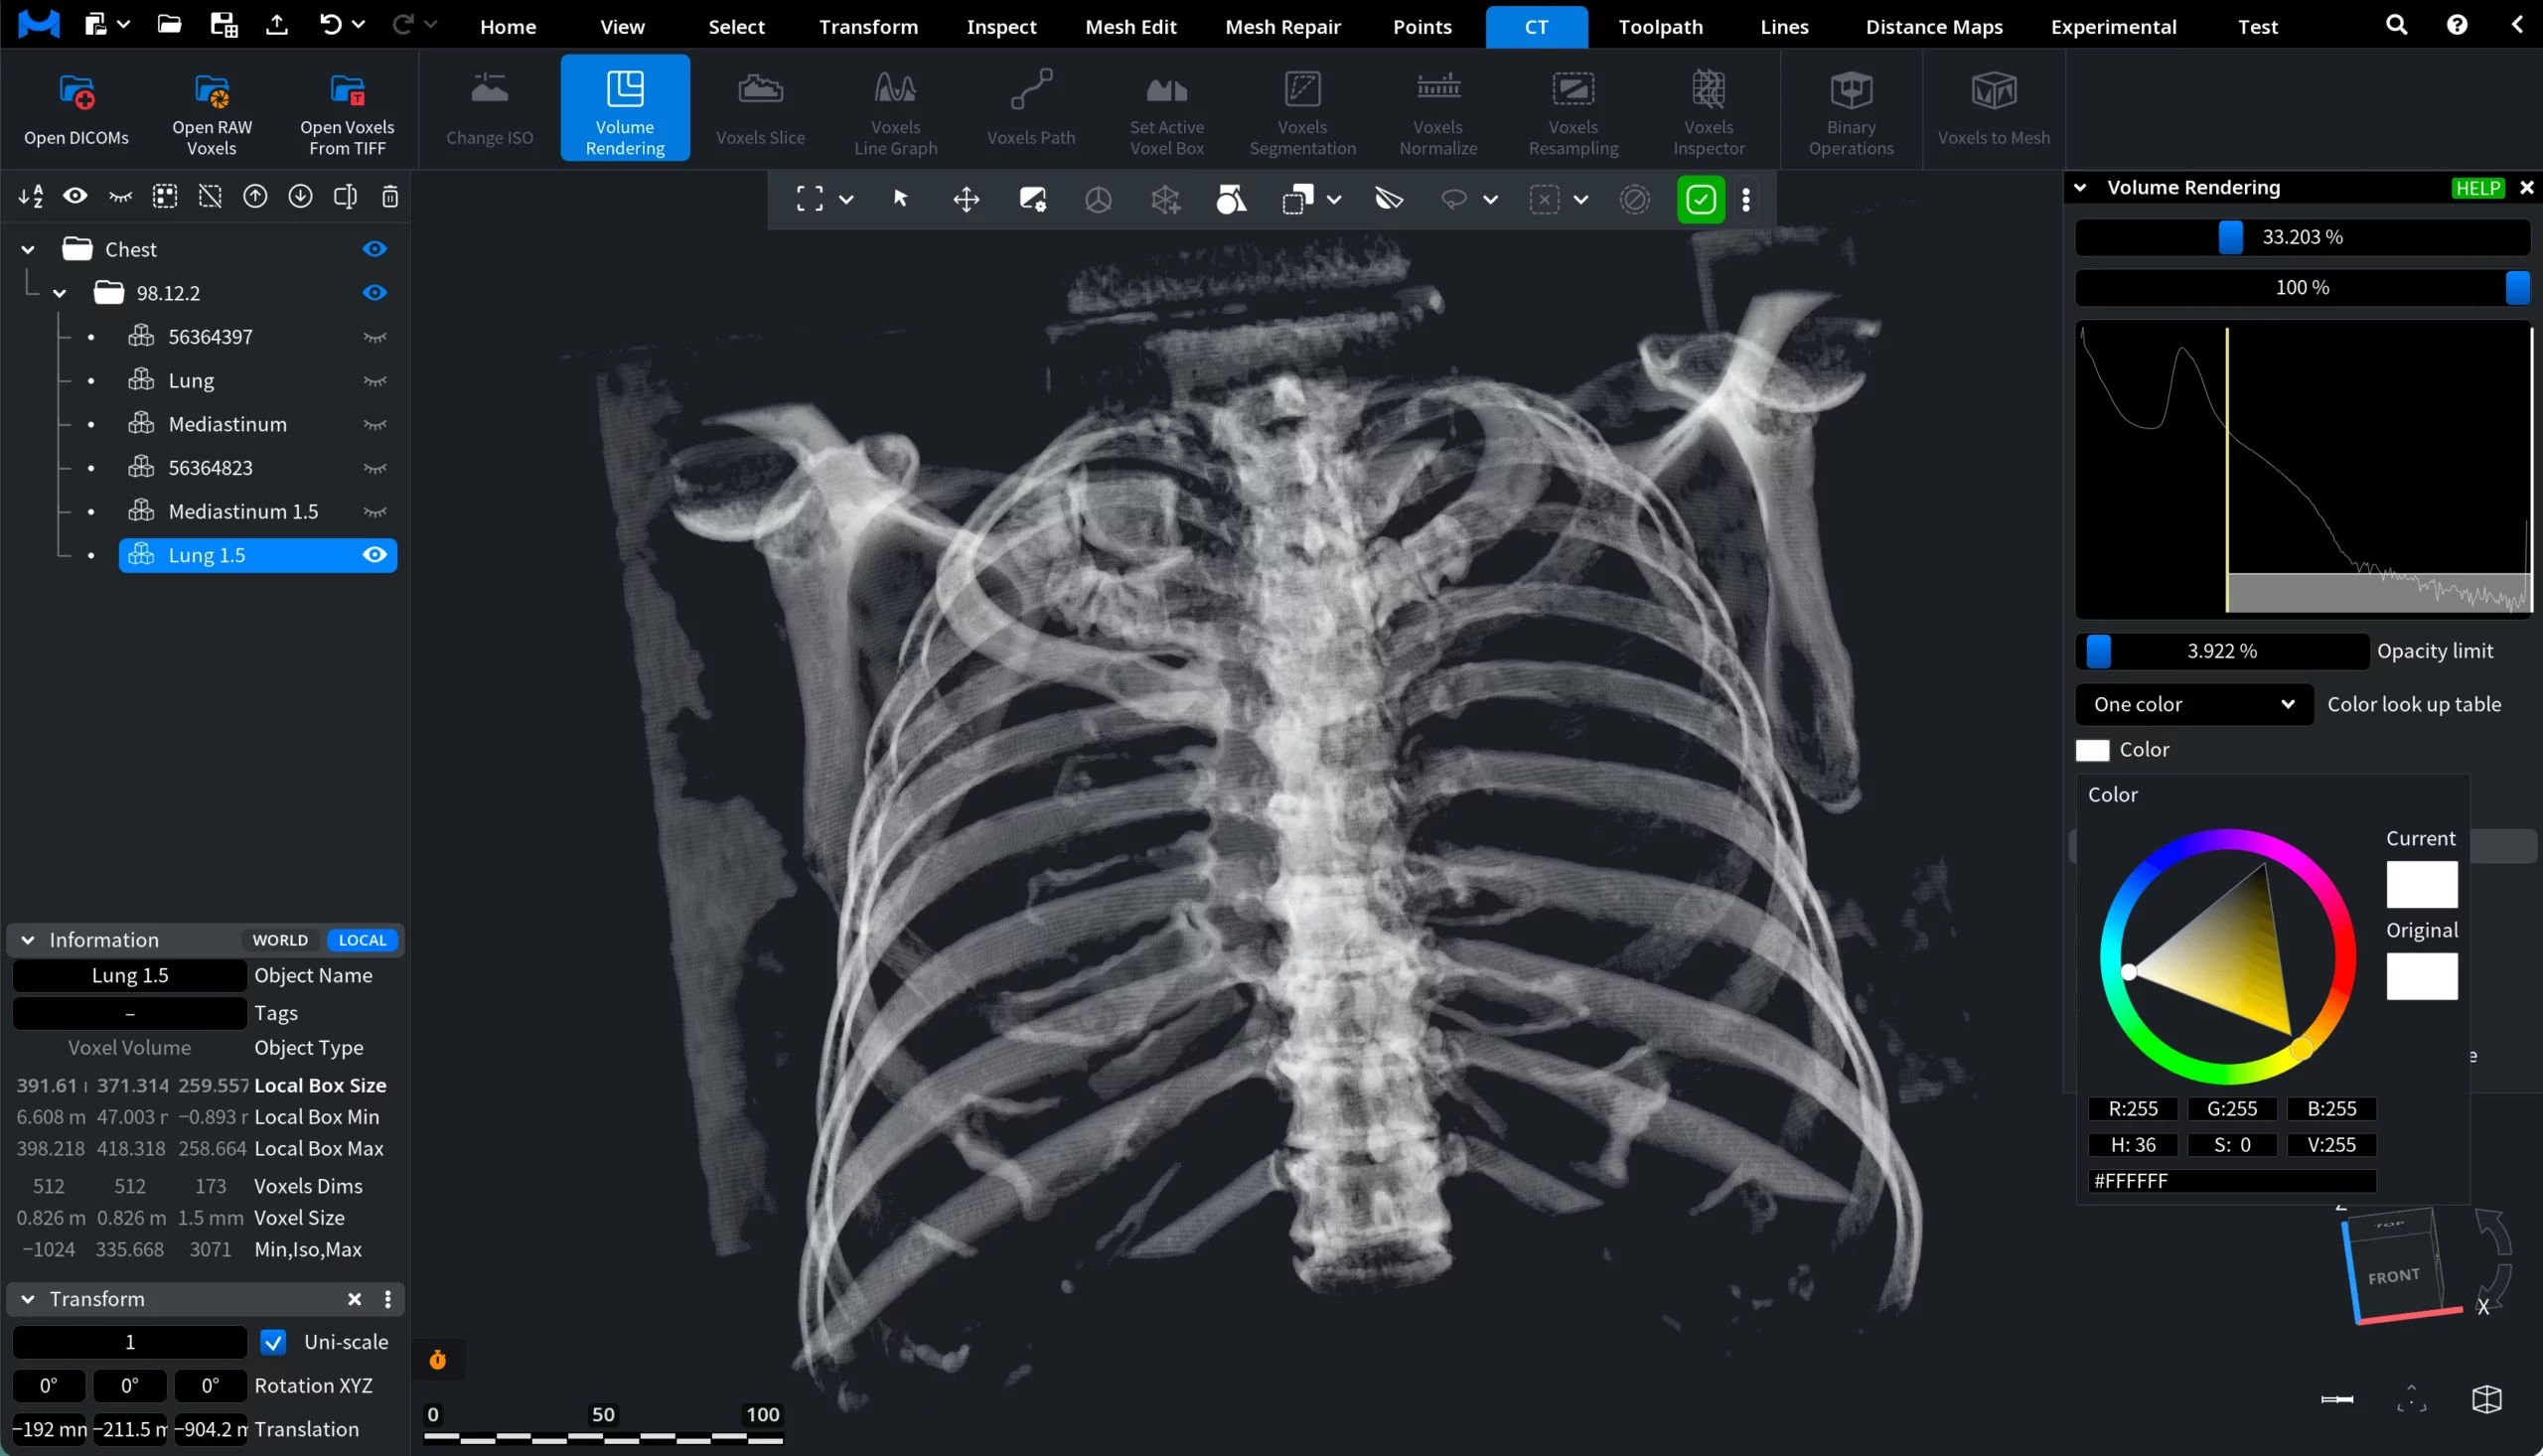
Gray shades maps voxel intensities to grayscale values, which resembles the appearance of traditional CT images.
Rainbow assigns a wide range of colors to voxel intensities, making it easier to distinguish density variations within the volume.
One color displays the entire voxel volume using a single selected color. When One color is selected, an additional color picker appears after you click on Color, allowing you to manually choose the color used to render the voxel volume.
Opacity mode defines how voxel intensity values influence the opacity of the rendered volume. Different modes apply different rules that determine which voxel densities appear more visible or more transparent:
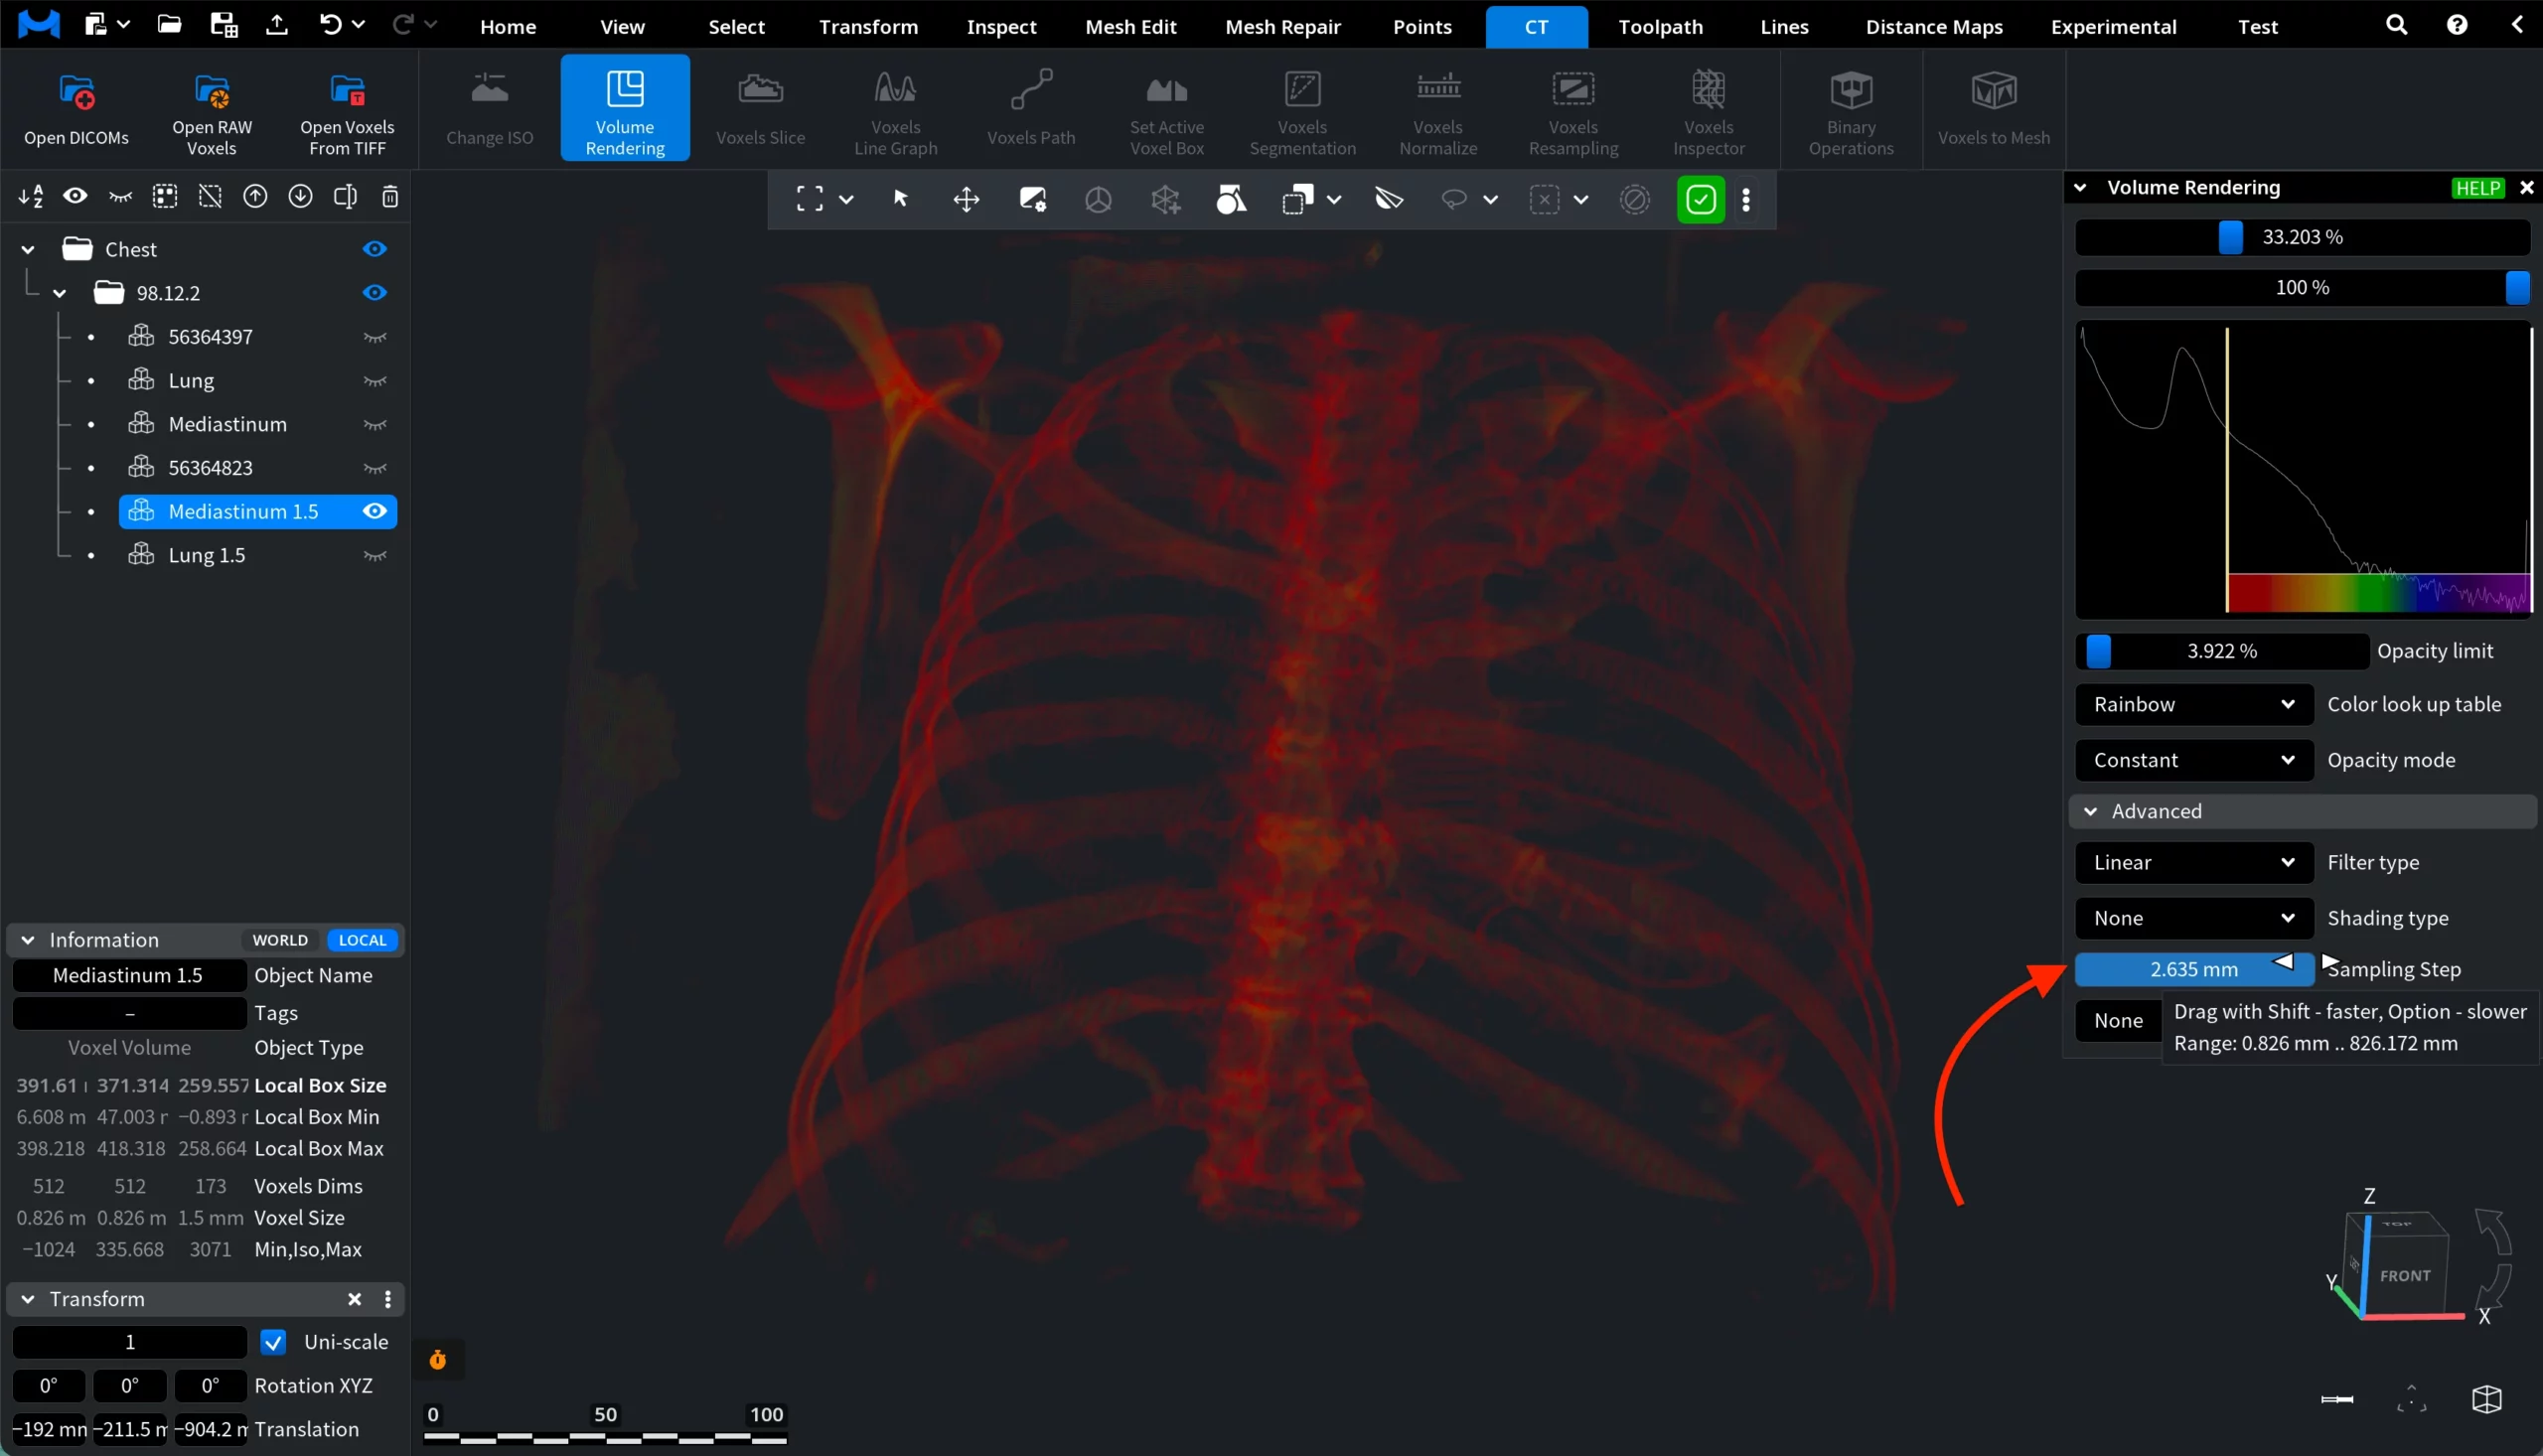
Constant. All voxels within the selected intensity range use the same opacity value. The volume appears uniformly transparent or opaque depending on the Opacity limit setting.
Linear increasing. Opacity gradually increases with voxel intensity.
Linear decreasing. Opacity gradually decreases with voxel intensity.
Changing the Opacity mode allows you to emphasize different density ranges within the voxel volume, which can help reveal specific anatomical or structural features in the data.
Advanced Volume Rendering Settings
Filter type defines how voxel values are interpolated when the volume is rendered. This affects the smoothness of the visualization and how individual voxels appear on the screen. Two filter types are available:
Linear interpolates voxel values between neighboring voxels. This produces a smoother and more continuous visualization.
Discrete displays voxels without interpolation between neighboring values. Each voxel is rendered independently, which makes the voxel grid more visible.
The Shading type parameter defines how lighting and shading are applied to the rendered voxel volume. Shading helps emphasize structural details by simulating how light interacts with the volume. Three shading modes are available:
None
Value Gradient
Alpha Gradient
Sampling Step controls the distance between sampling points used during volume rendering. It defines how frequently the rendering algorithm samples voxel values along each viewing ray:
Smaller sampling step values increase the number of samples taken within the volume. This produces more detailed and accurate visualization, but it may reduce rendering performance.
Larger sampling step values reduce the number of samples. Rendering becomes faster, but fine internal structures may appear less detailed or partially lost.
Voxels Cut Mode
Voxels Cut Mode allows you to selectively remove or isolate parts of a voxel volume during volume rendering. This tool is useful for inspecting internal structures or focusing on specific regions of the dataset.
None
When None is selected, no cutting or filtering is applied to the voxel volume. The entire dataset is rendered according to the current volume rendering settings.
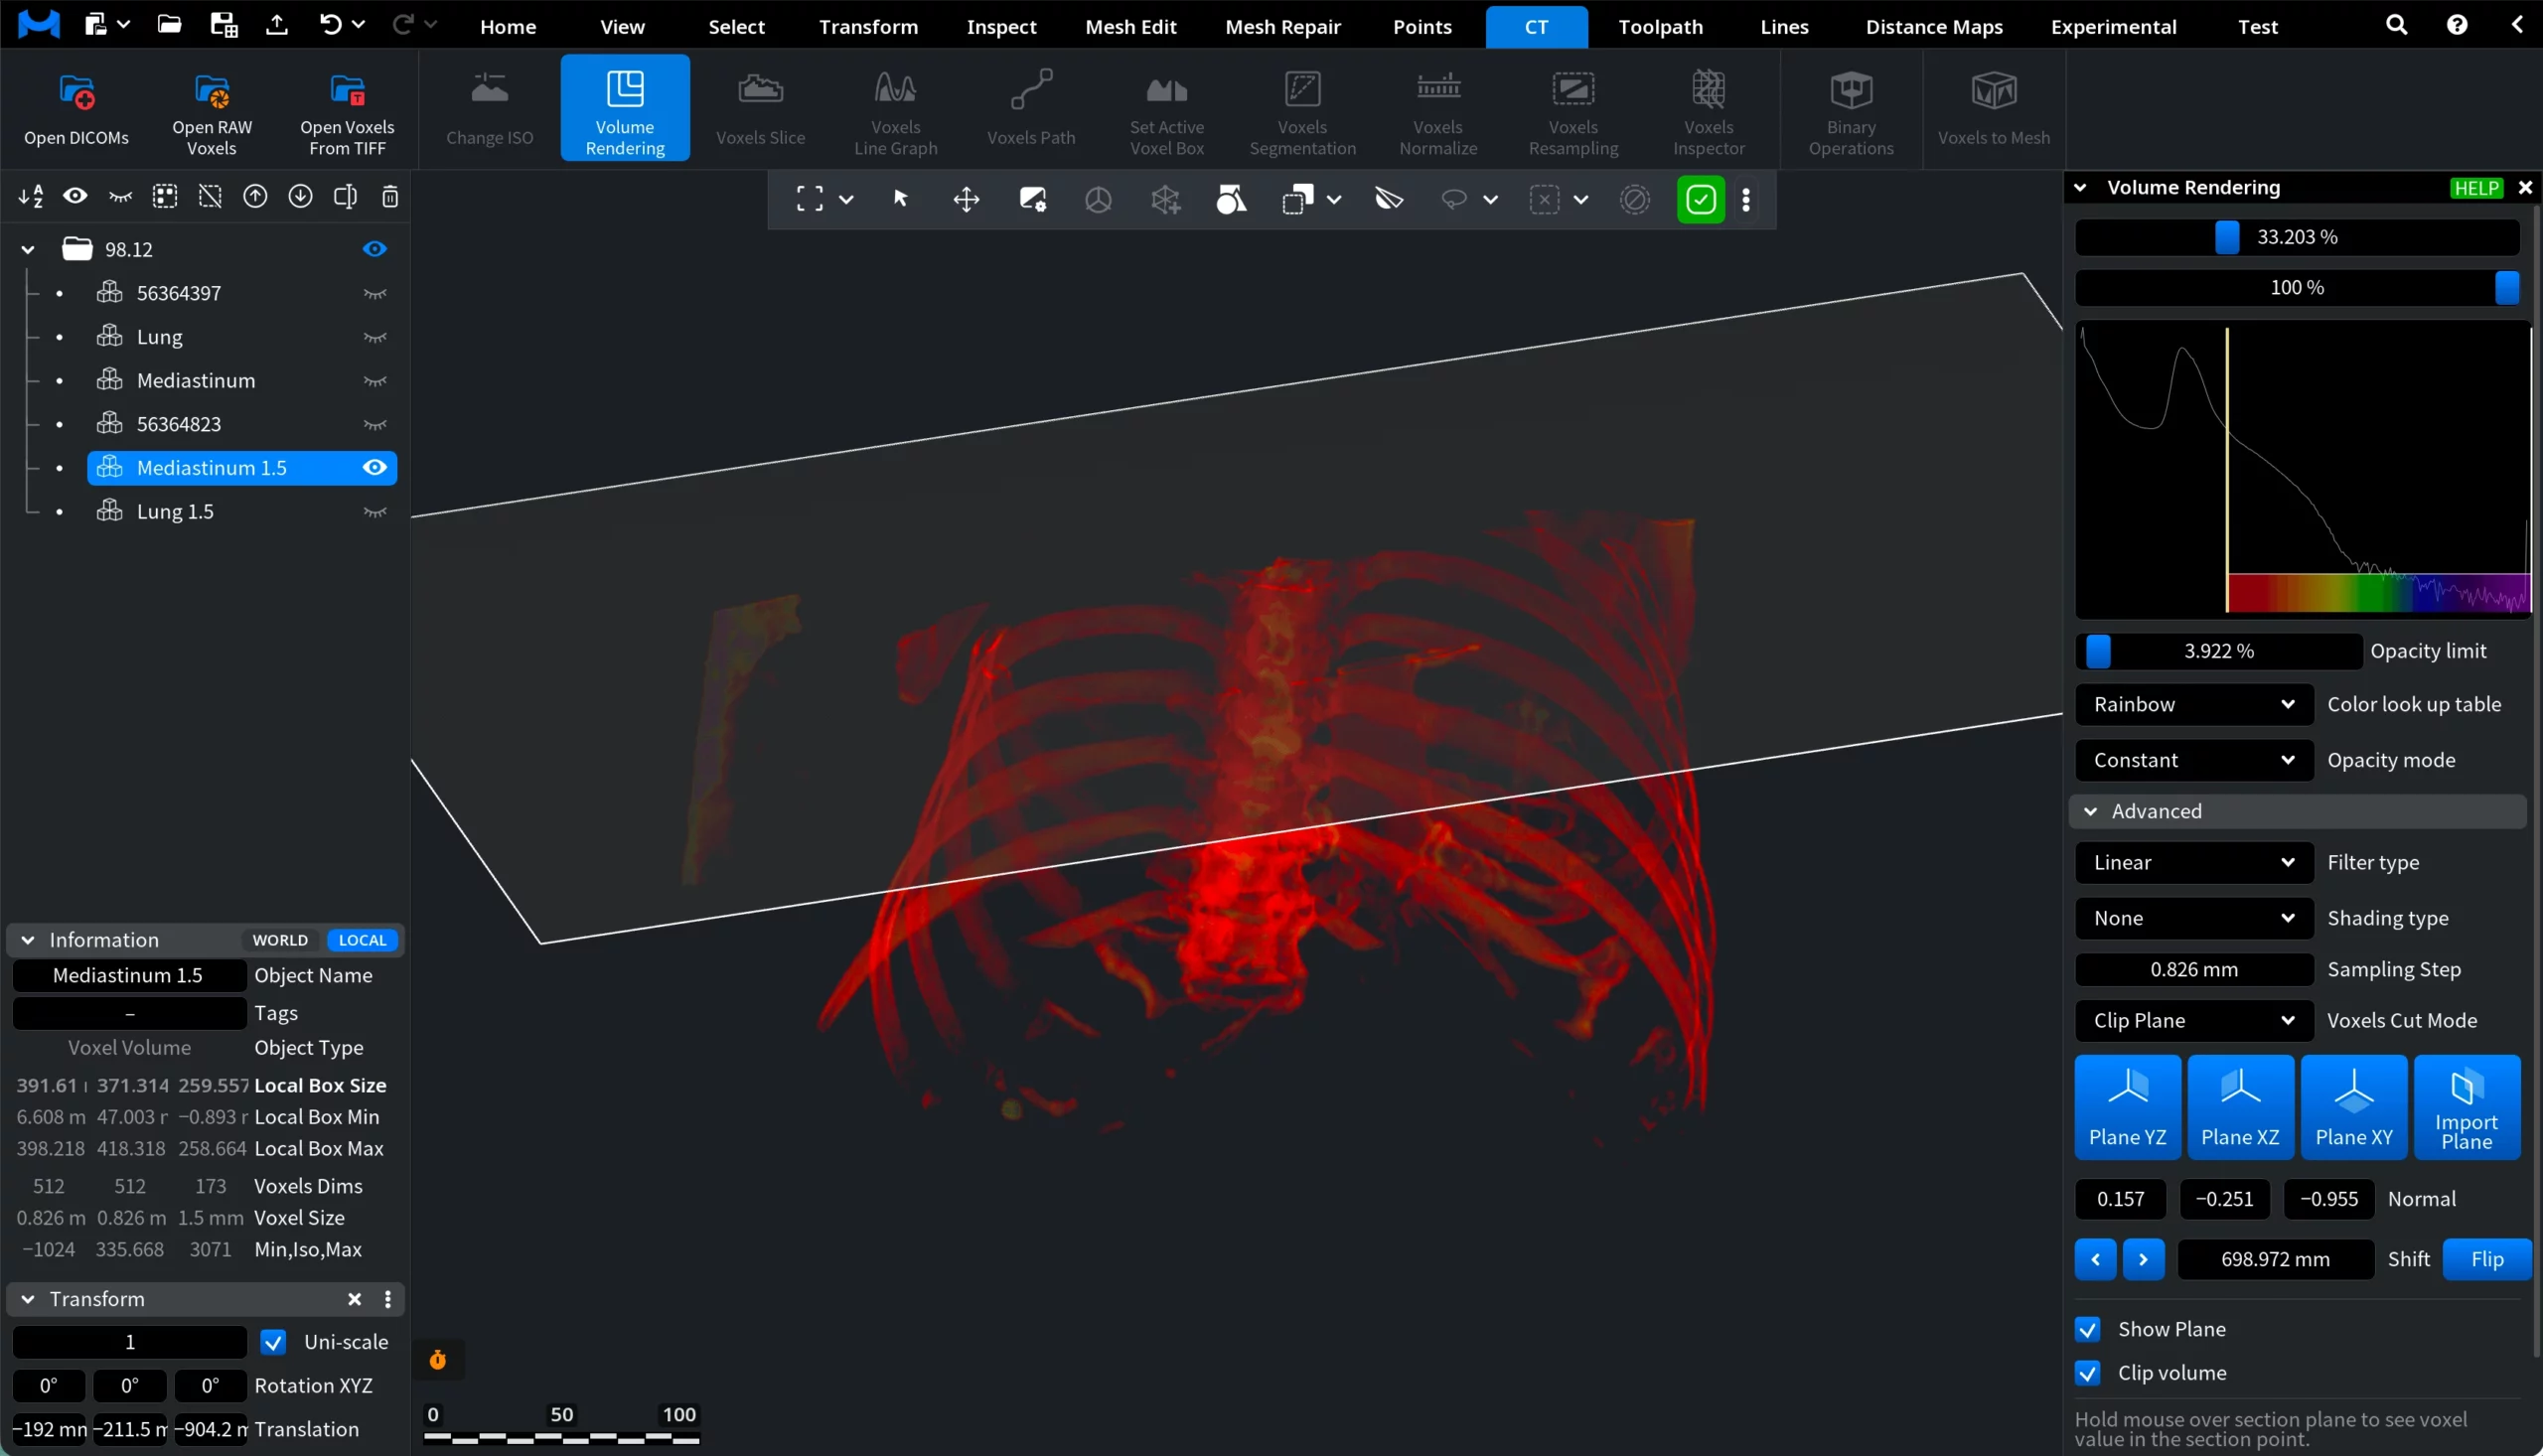
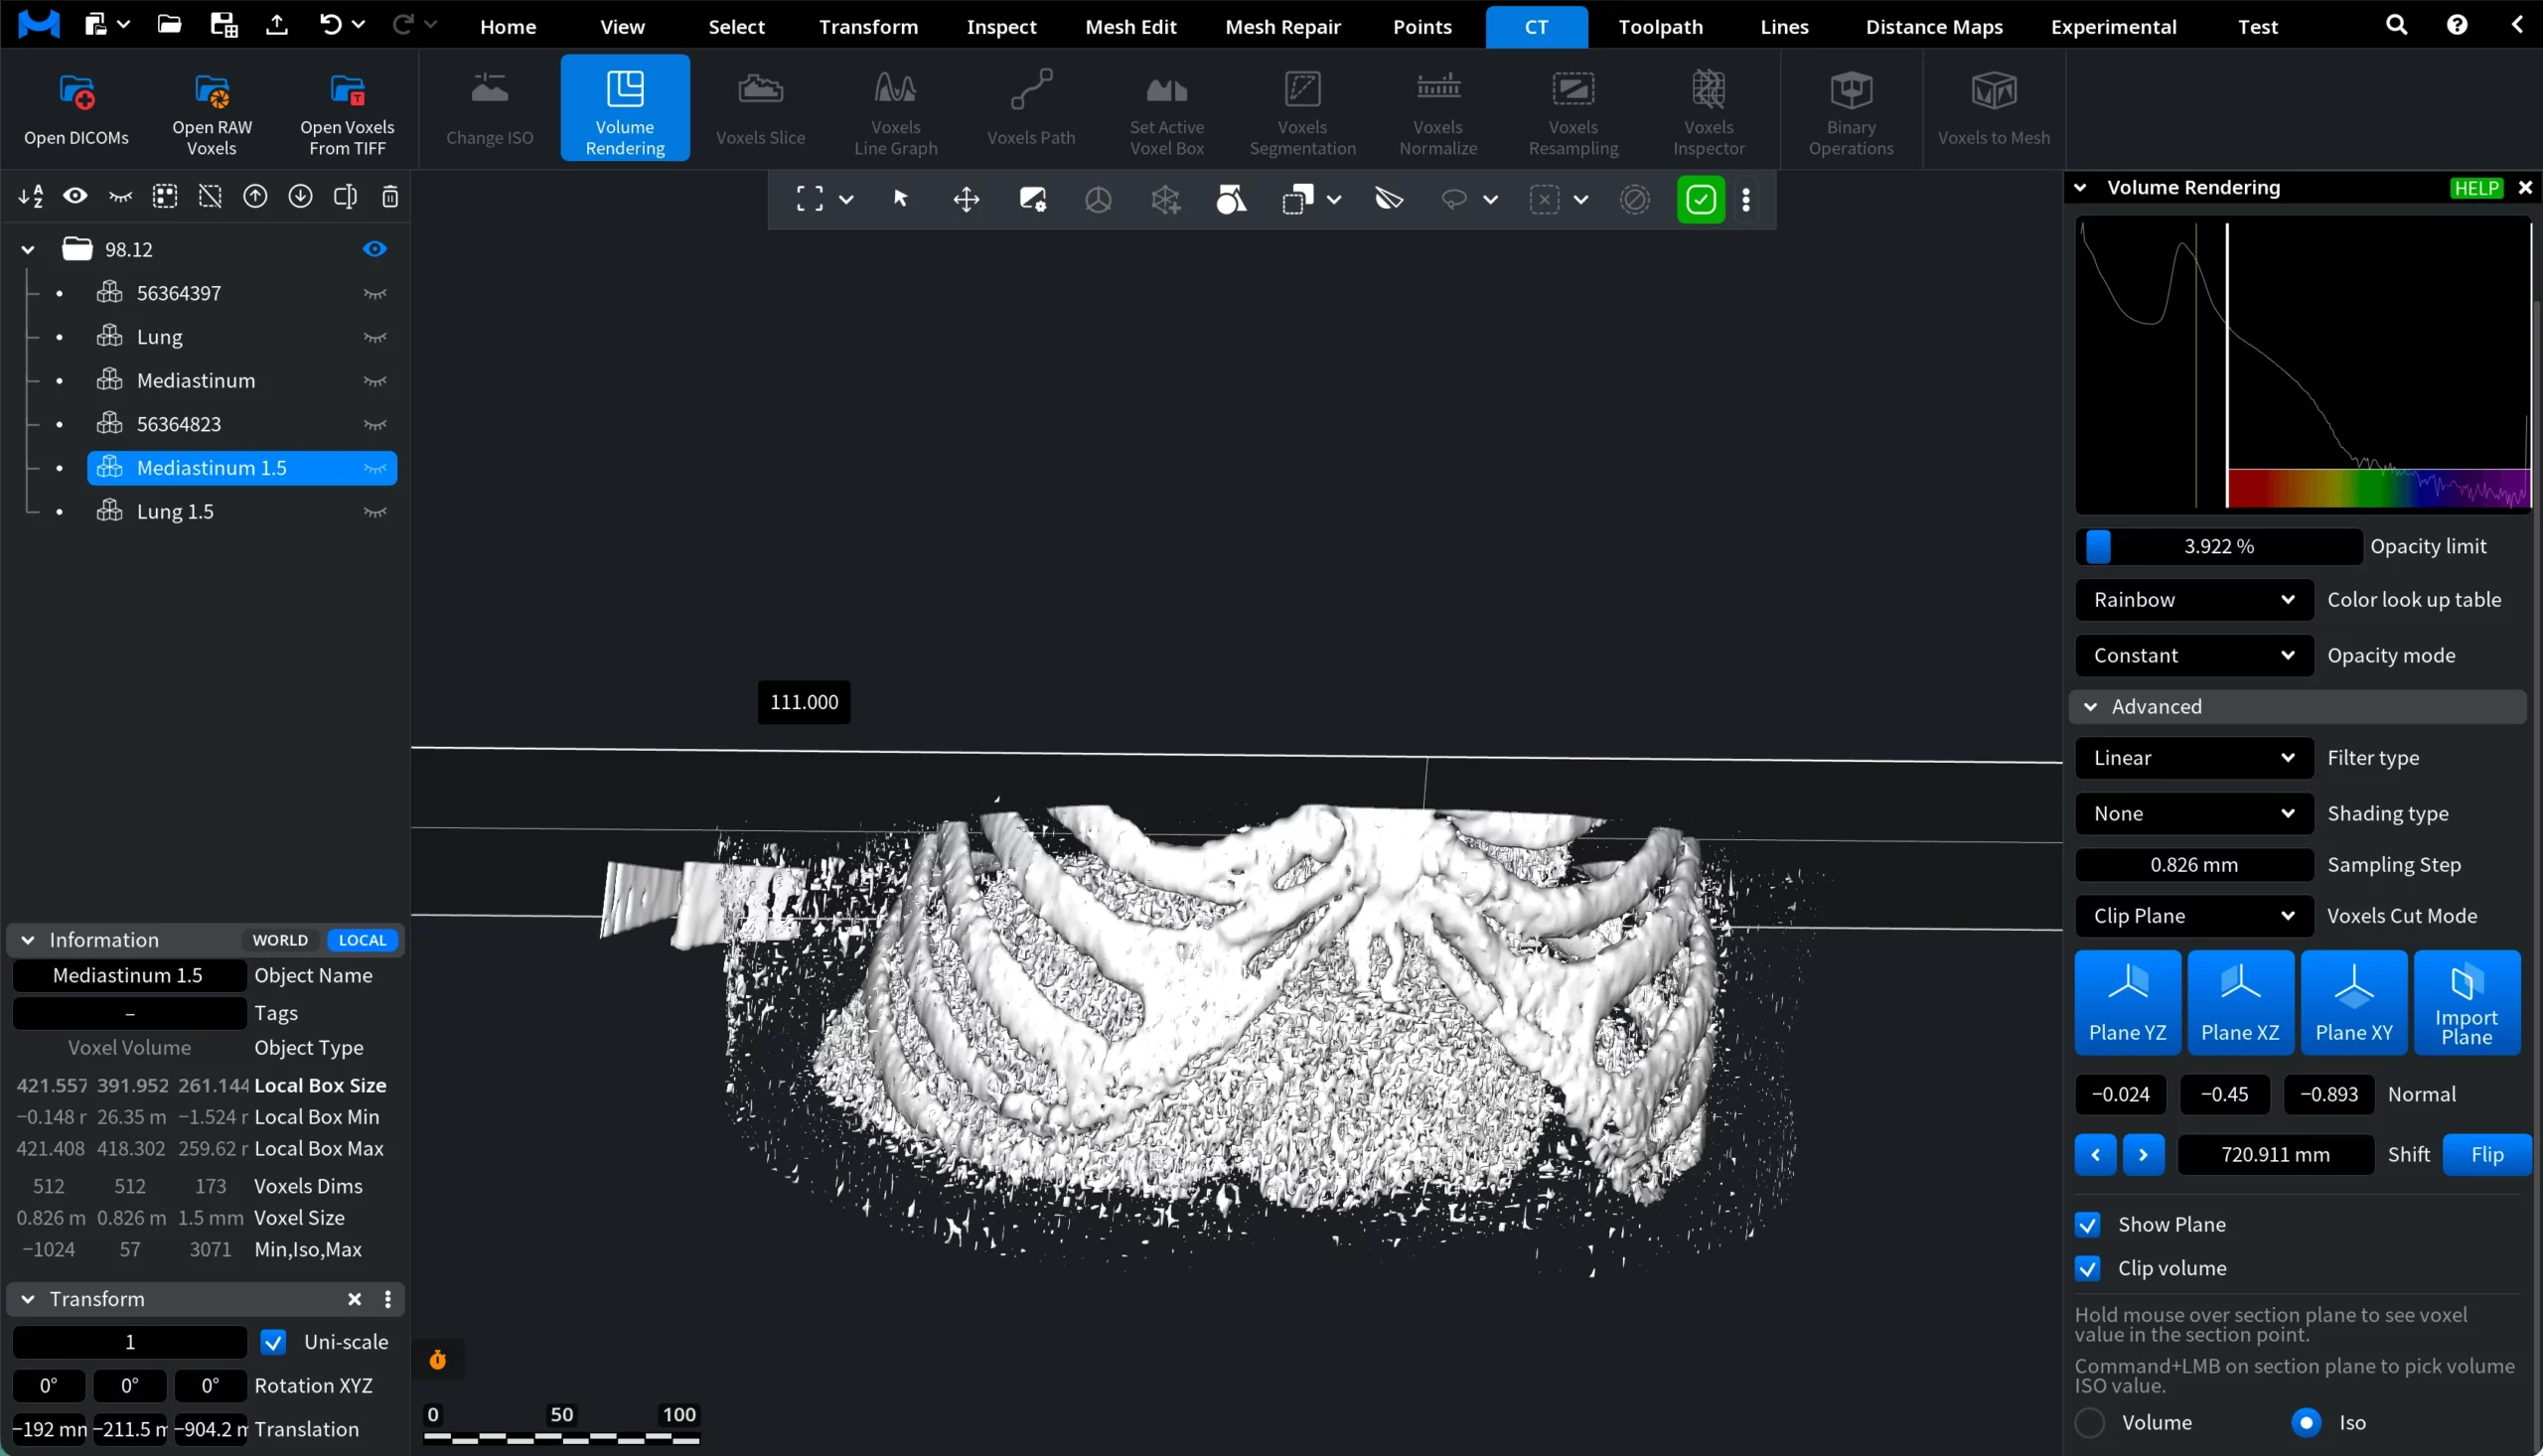
Clip Plane
The Clip Plane mode allows you to cut the voxel volume using an adjustable geometric plane. Several orientations are available:
Plane YZ
Plane XZ
Plane XY
Import Plane
These planes slice the volume along the corresponding coordinate axes. The plane position and orientation can be adjusted using the Normal and Shift parameters. Also, you can draw the plane manually by clicking and dragging the left mouse button.
Additional options include:
Show Plane displays the clipping plane in the viewport.
Clip Volume hides the part of the volume located on one side of the plane.
Flip reverses the clipping direction.
This mode is useful for revealing internal structures by cutting through the voxel data.
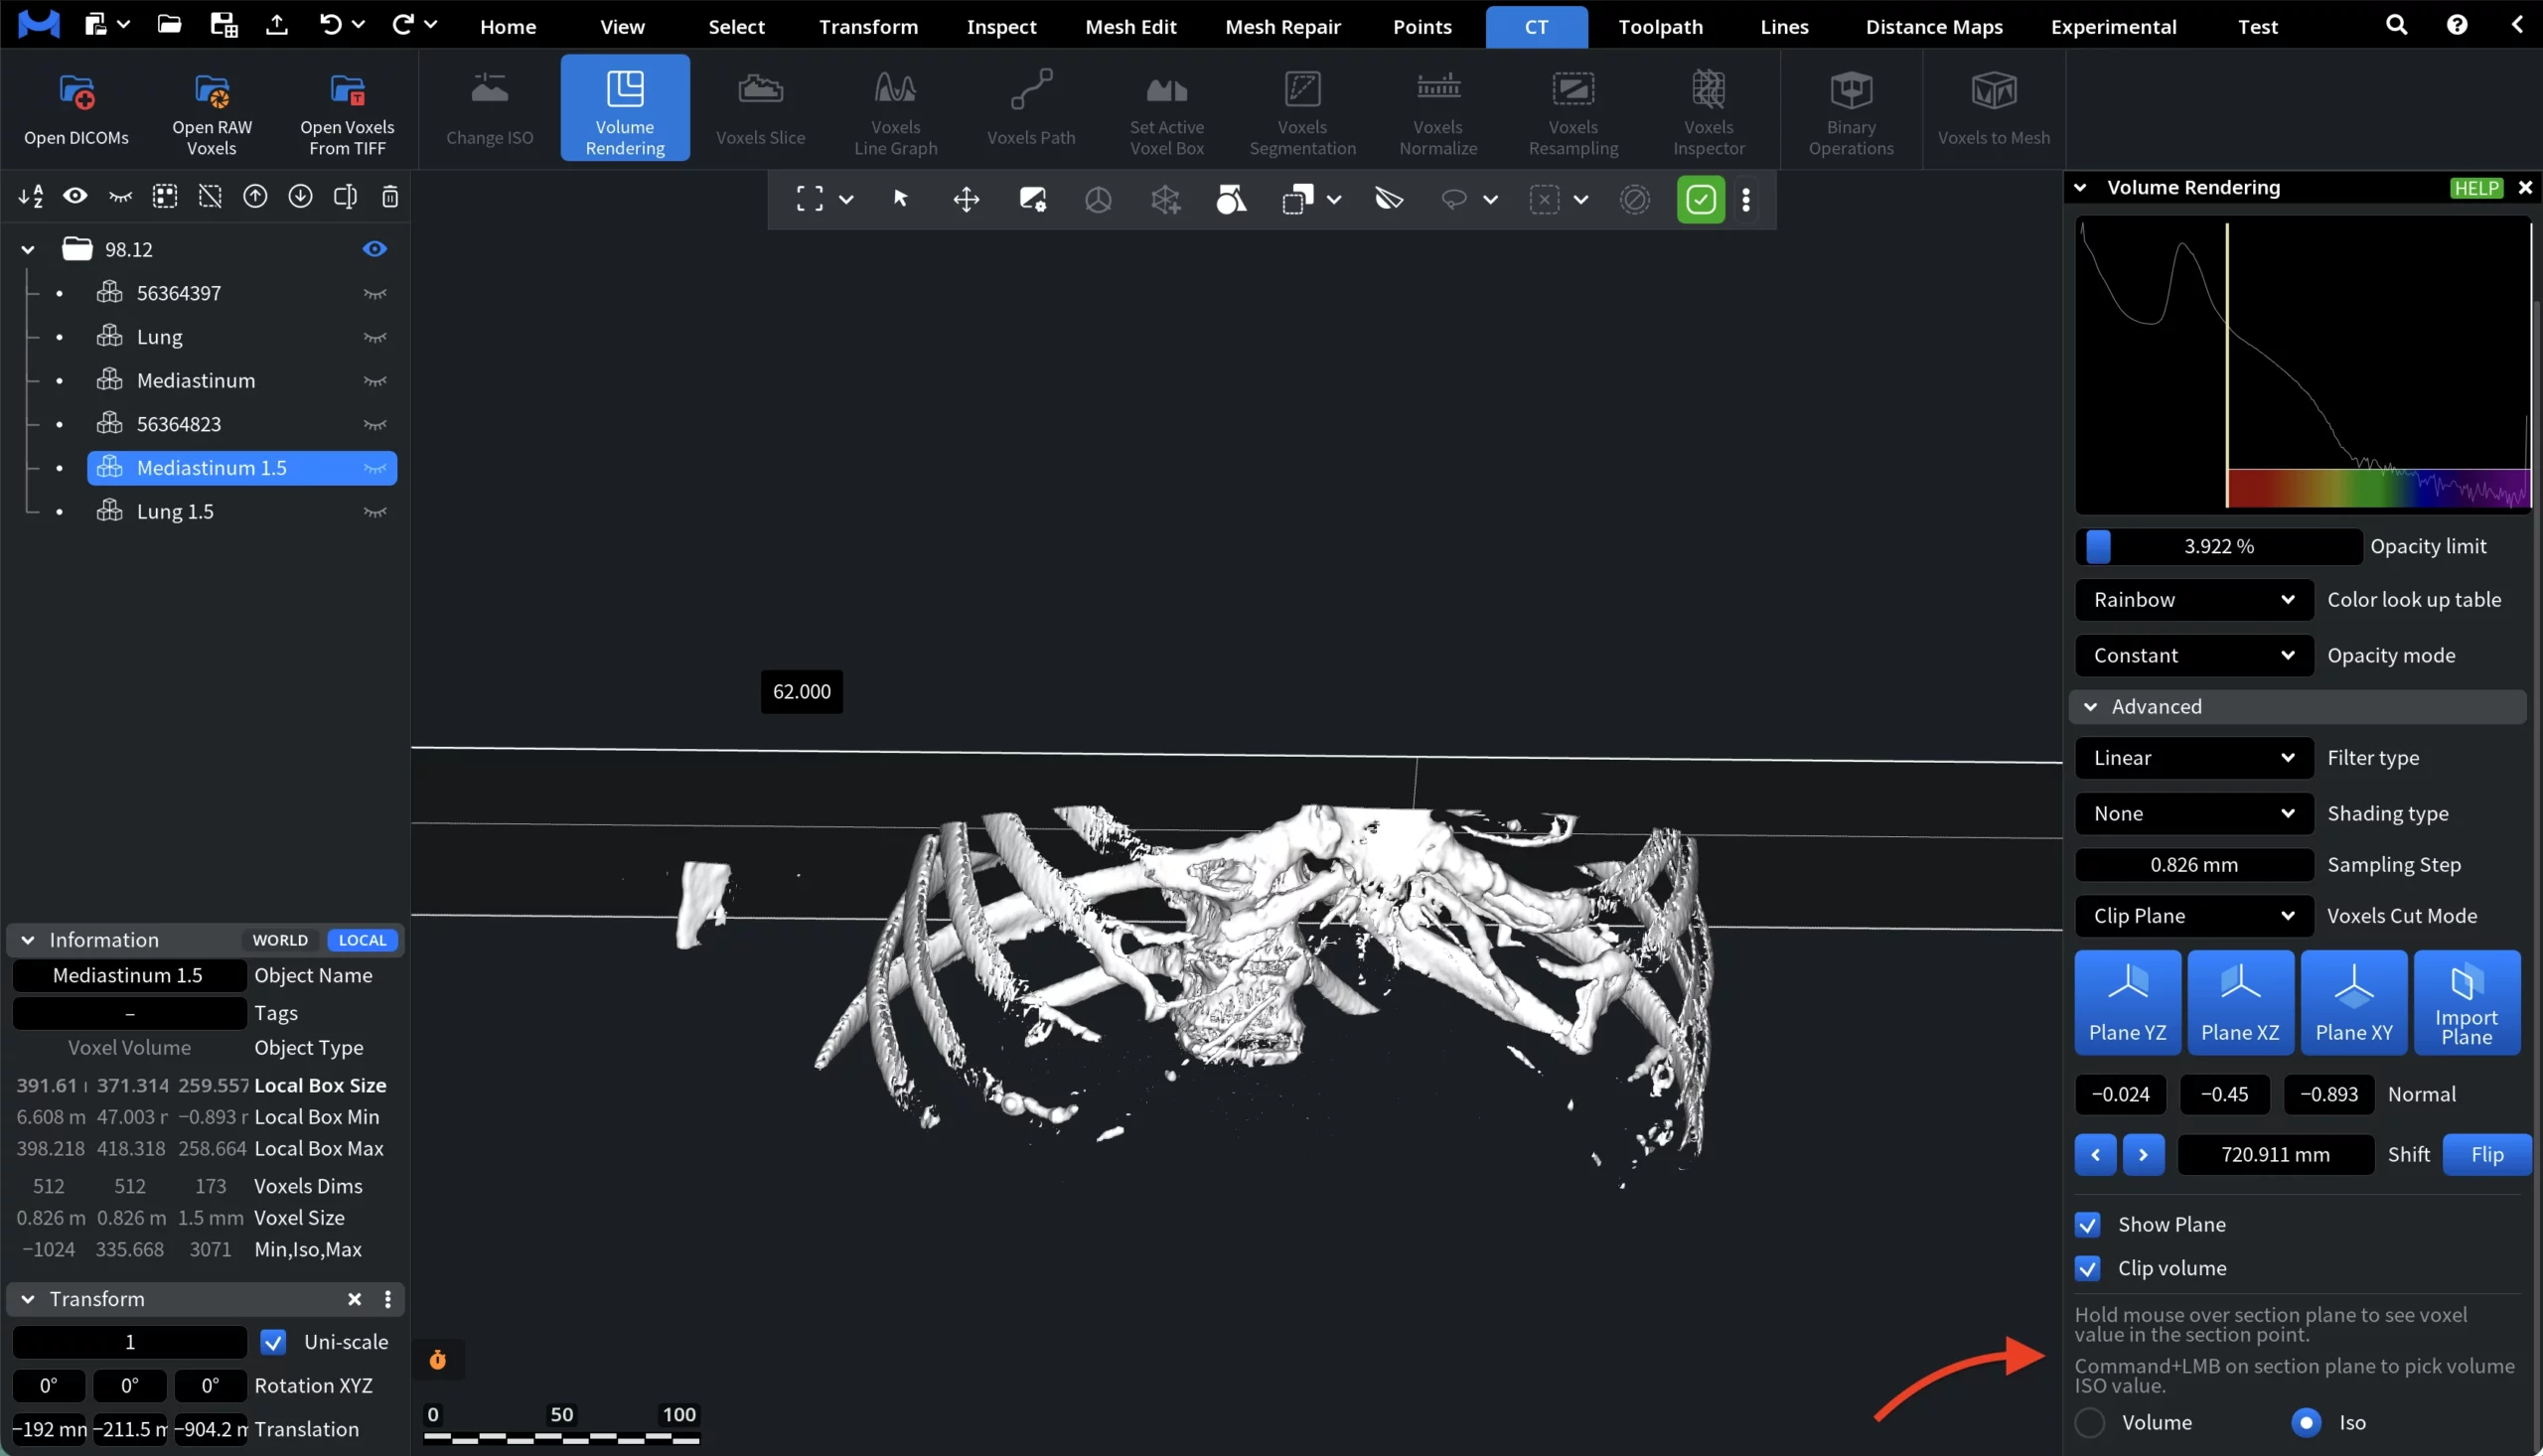
You can also choose how the clipped data is displayed:
Volume continues rendering the clipped volume.
Iso shows the extracted iso-surface of the clipped region.
When Clip Plane mode is active, you can inspect voxel values directly on the cutting plane and quickly use them to define an iso value:
Hover the cursor over the clip plane. Move the cursor across the clipping plane to preview voxel values. The value of the voxel under the cursor is displayed in the viewport.
Inspect the value. This allows you to quickly understand the density of structures intersected by the plane (for example bone, tissue, or air).
Apply the value as an iso value. Hold Command and Left-Click on the clip plane to set the iso value using the voxel under the cursor.
Voxel Value: Holding the Cursor
Voxel Value: After Command+LMB
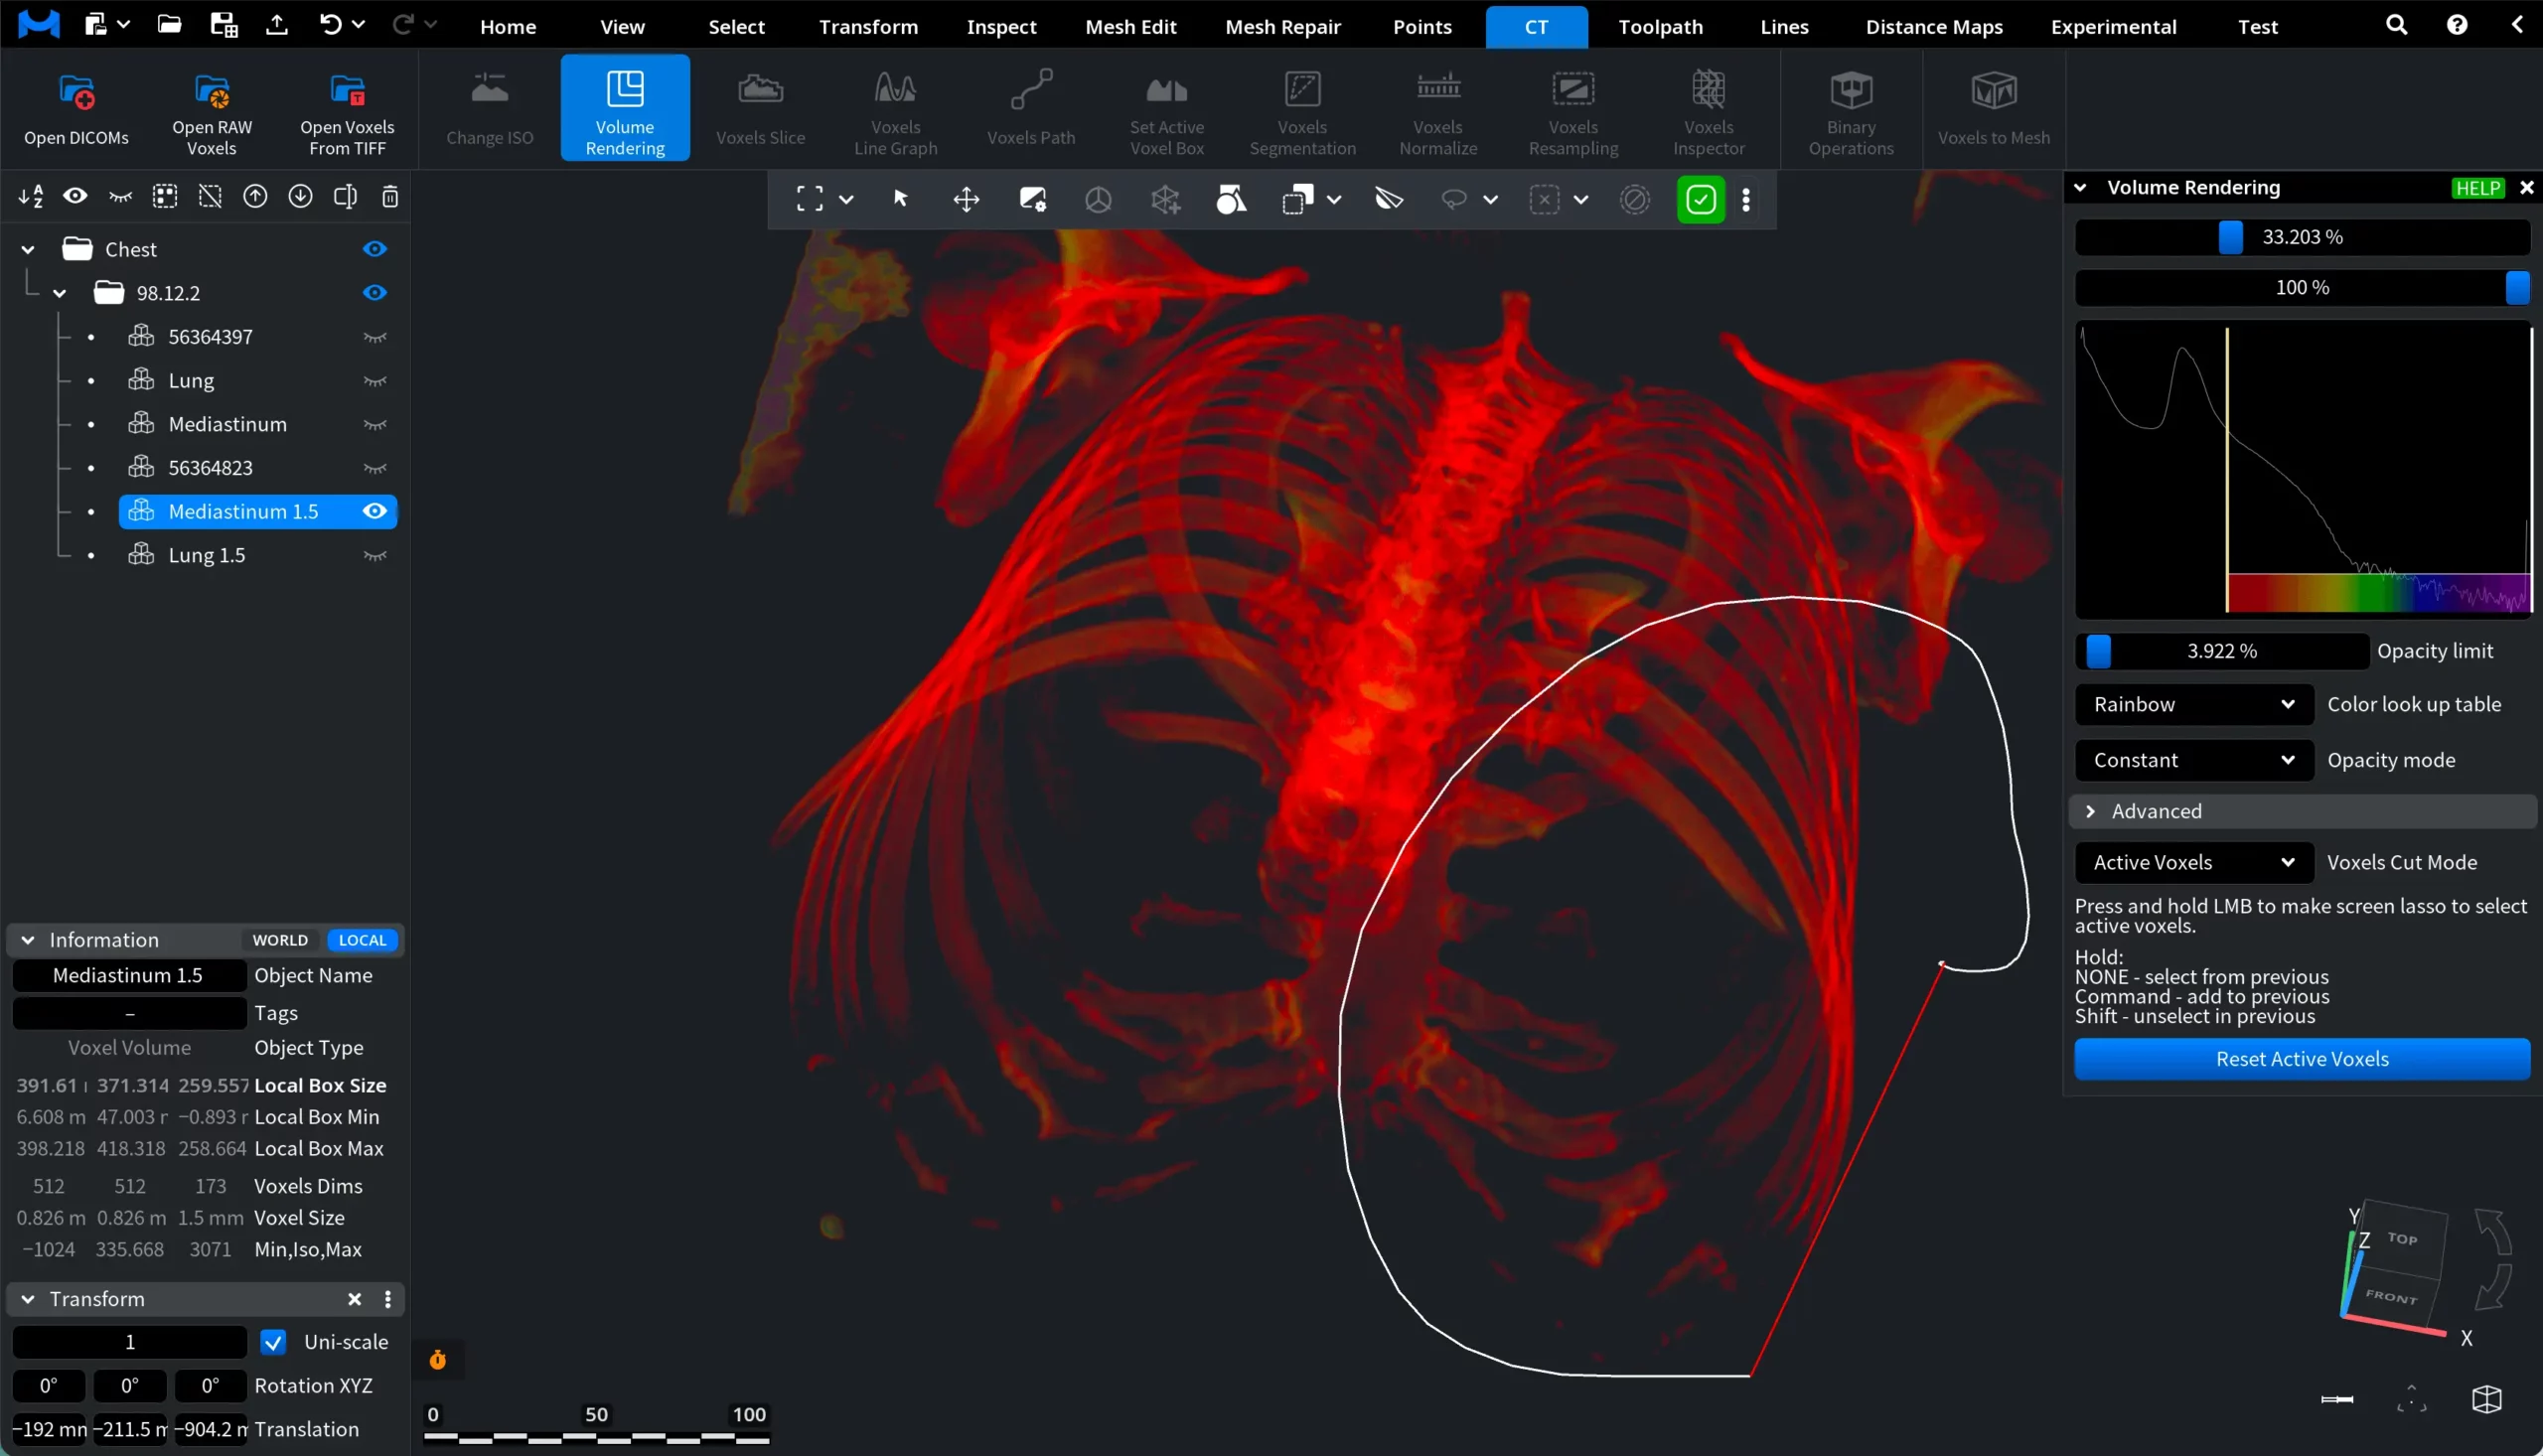
Active Voxels
The Active Voxels mode enables manual selection of voxels directly in the viewport. You can select regions using a lasso selection:
Press and hold the left mouse button to draw a selection area.
Command adds voxels to the current selection.
Shift removes voxels from the selection.
This allows you to isolate or hide specific areas of the dataset. A Reset Active Voxels button is available to clear the current selection and restore the full volume.
How the Volume Rendering Tool Works in MeshInspector