When working with voxel volumes, it is often useful to analyze how voxel values change across a specific region of the dataset. Instead of inspecting individual slices, you may want to examine how density values vary along a line. MeshInspector provides the Voxels Line Graph tool to visualize voxel values along a line aligned with one of the voxel grid axes inside a voxel volume. The tool samples voxel intensities along the selected axis and displays them as a graph, allowing you to analyze value distribution and detect changes in density. To access this tool, open the CT tab on the top toolbar and click Voxels Line Graph.

Once activated, a line appears inside the voxel volume. The tool samples voxel values along this line and displays them as a graph.
Voxels Line Graph Settings
When the tool is activated, two panels appear on the right side of the interface:
- Voxels Line Graph settings panel to define the axis and position of the sampling line;
- Graph panel that displays voxel values measured along the line.
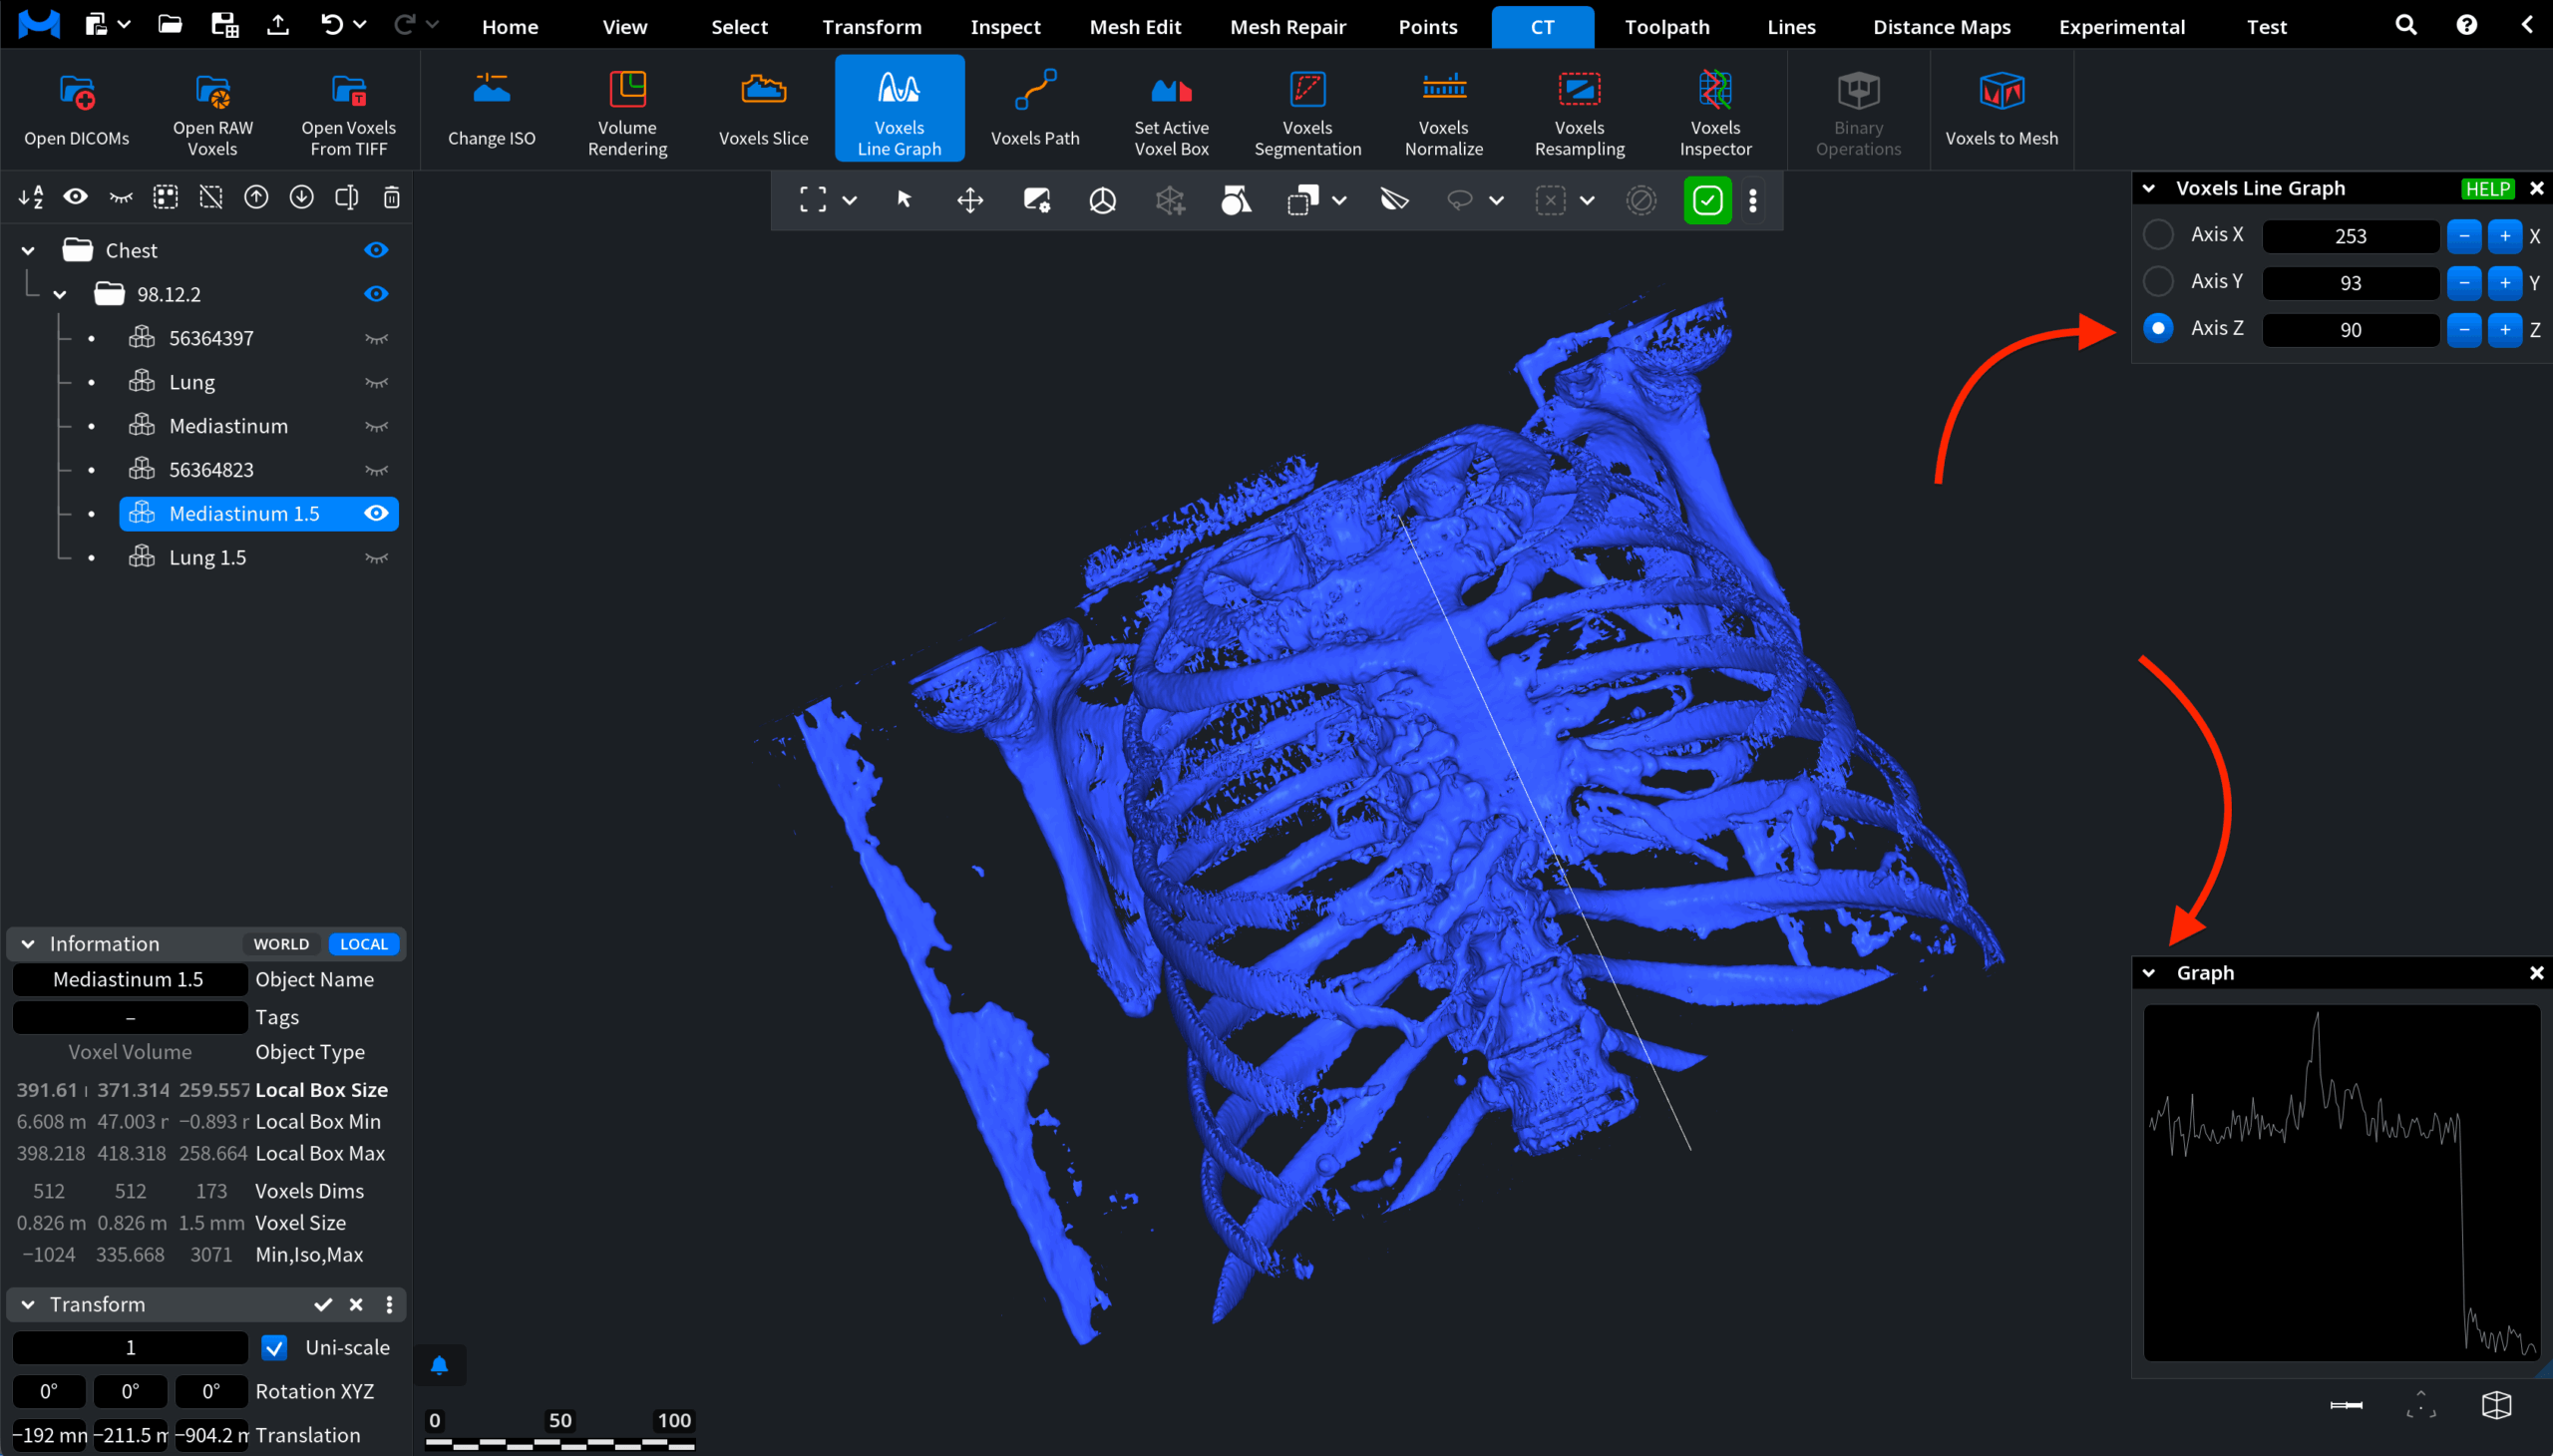
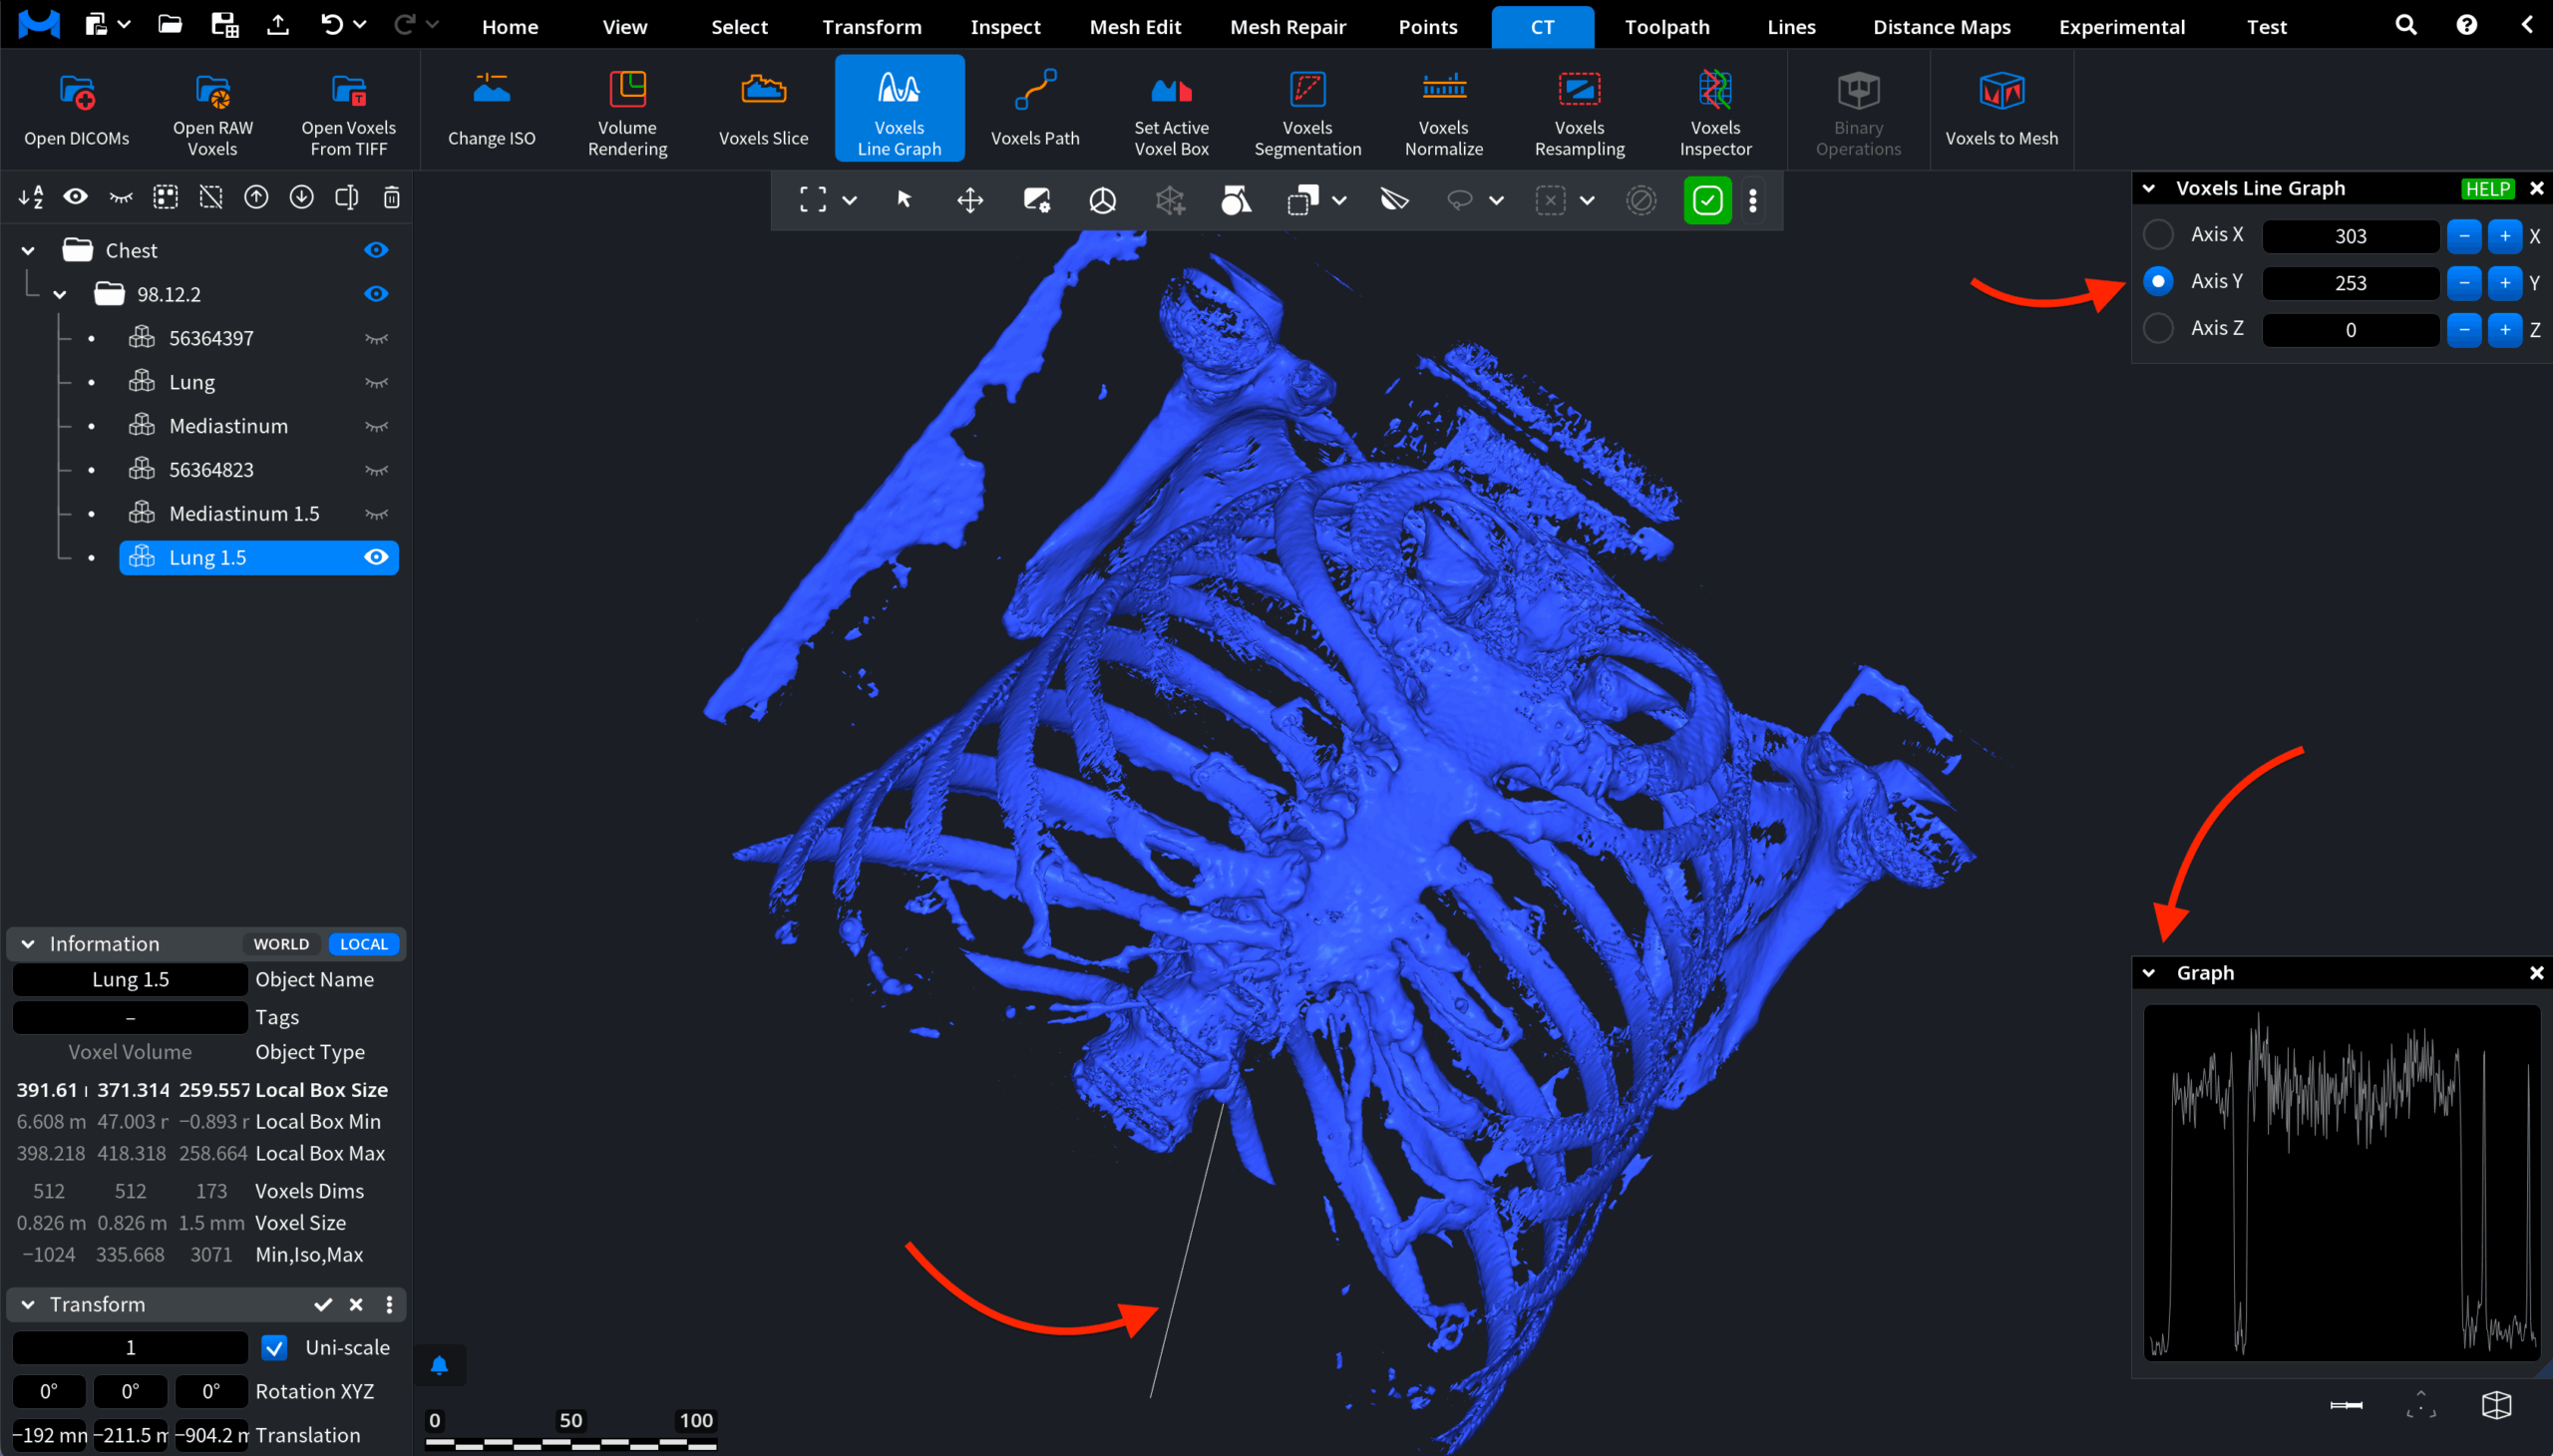
Axis X / Axis Y / Axis Z
These options define the direction of the sampling line:
- Axis X creates a line aligned with the X direction of the voxel grid.
- Axis Y creates a line aligned with the Y direction.
- Axis Z creates a line aligned with the Z direction.
The numeric field next to each option controls the position of the line within the voxel volume. Changing this value moves the line across the dataset, allowing you to analyze voxel values at different positions.