Those who work with CT datasets often face the need to examine the internal structure of a voxel volume in detail. For them, it is important to understand how voxel values change inside the volume, where density transitions occur, or whether the data contains artifacts or irregular gradients.
To address this need, MeshInspector provides a specialized Voxels Inspector tool designed to examine voxel gradients and internal voxel values with high precision. This tool allows users to inspect the dataset more closely and better understand the volumetric structure before performing further operations.
To access this functionality, open the CT tab in the top toolbar and select Voxels Inspector.

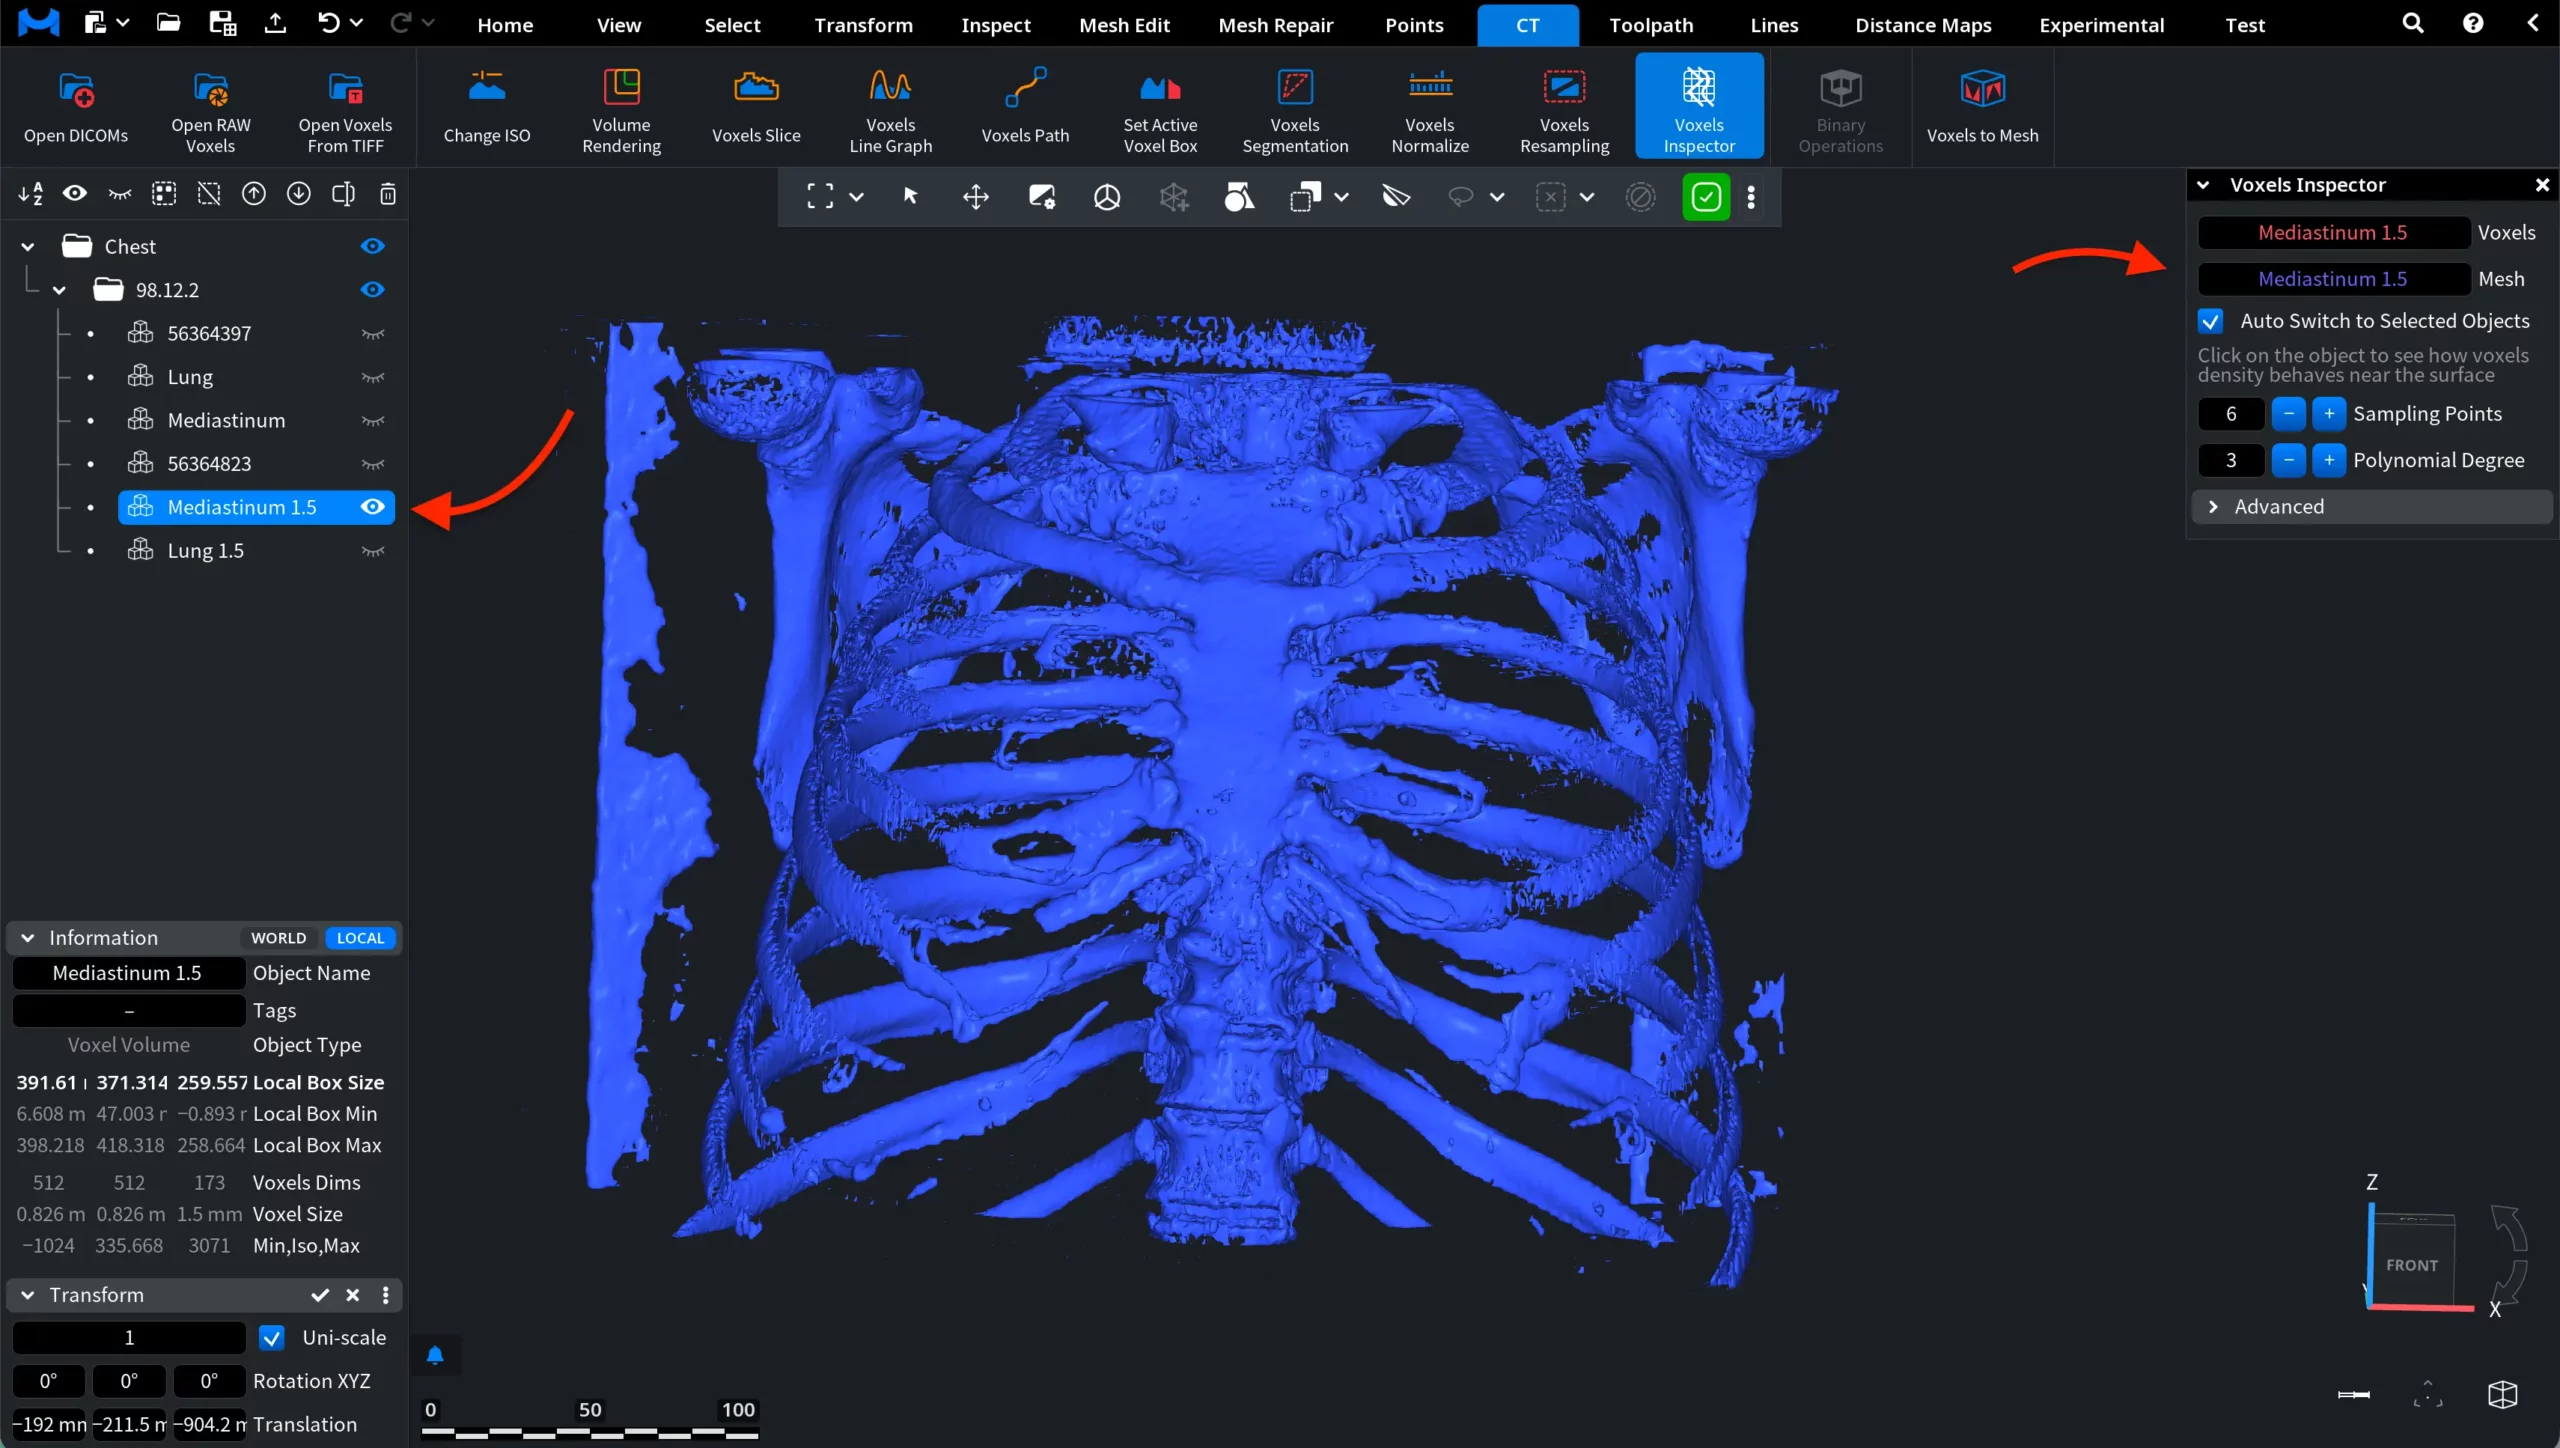
Note: there are no mesh objects in the Scene Tree. That is, MeshInspector internally derives a surface mesh from the voxel dataset. This surface is generated automatically from the voxel volume. The mesh is not added as a separate object in the scene but is created temporarily so that the system can analyze how voxel density behaves near the surface.
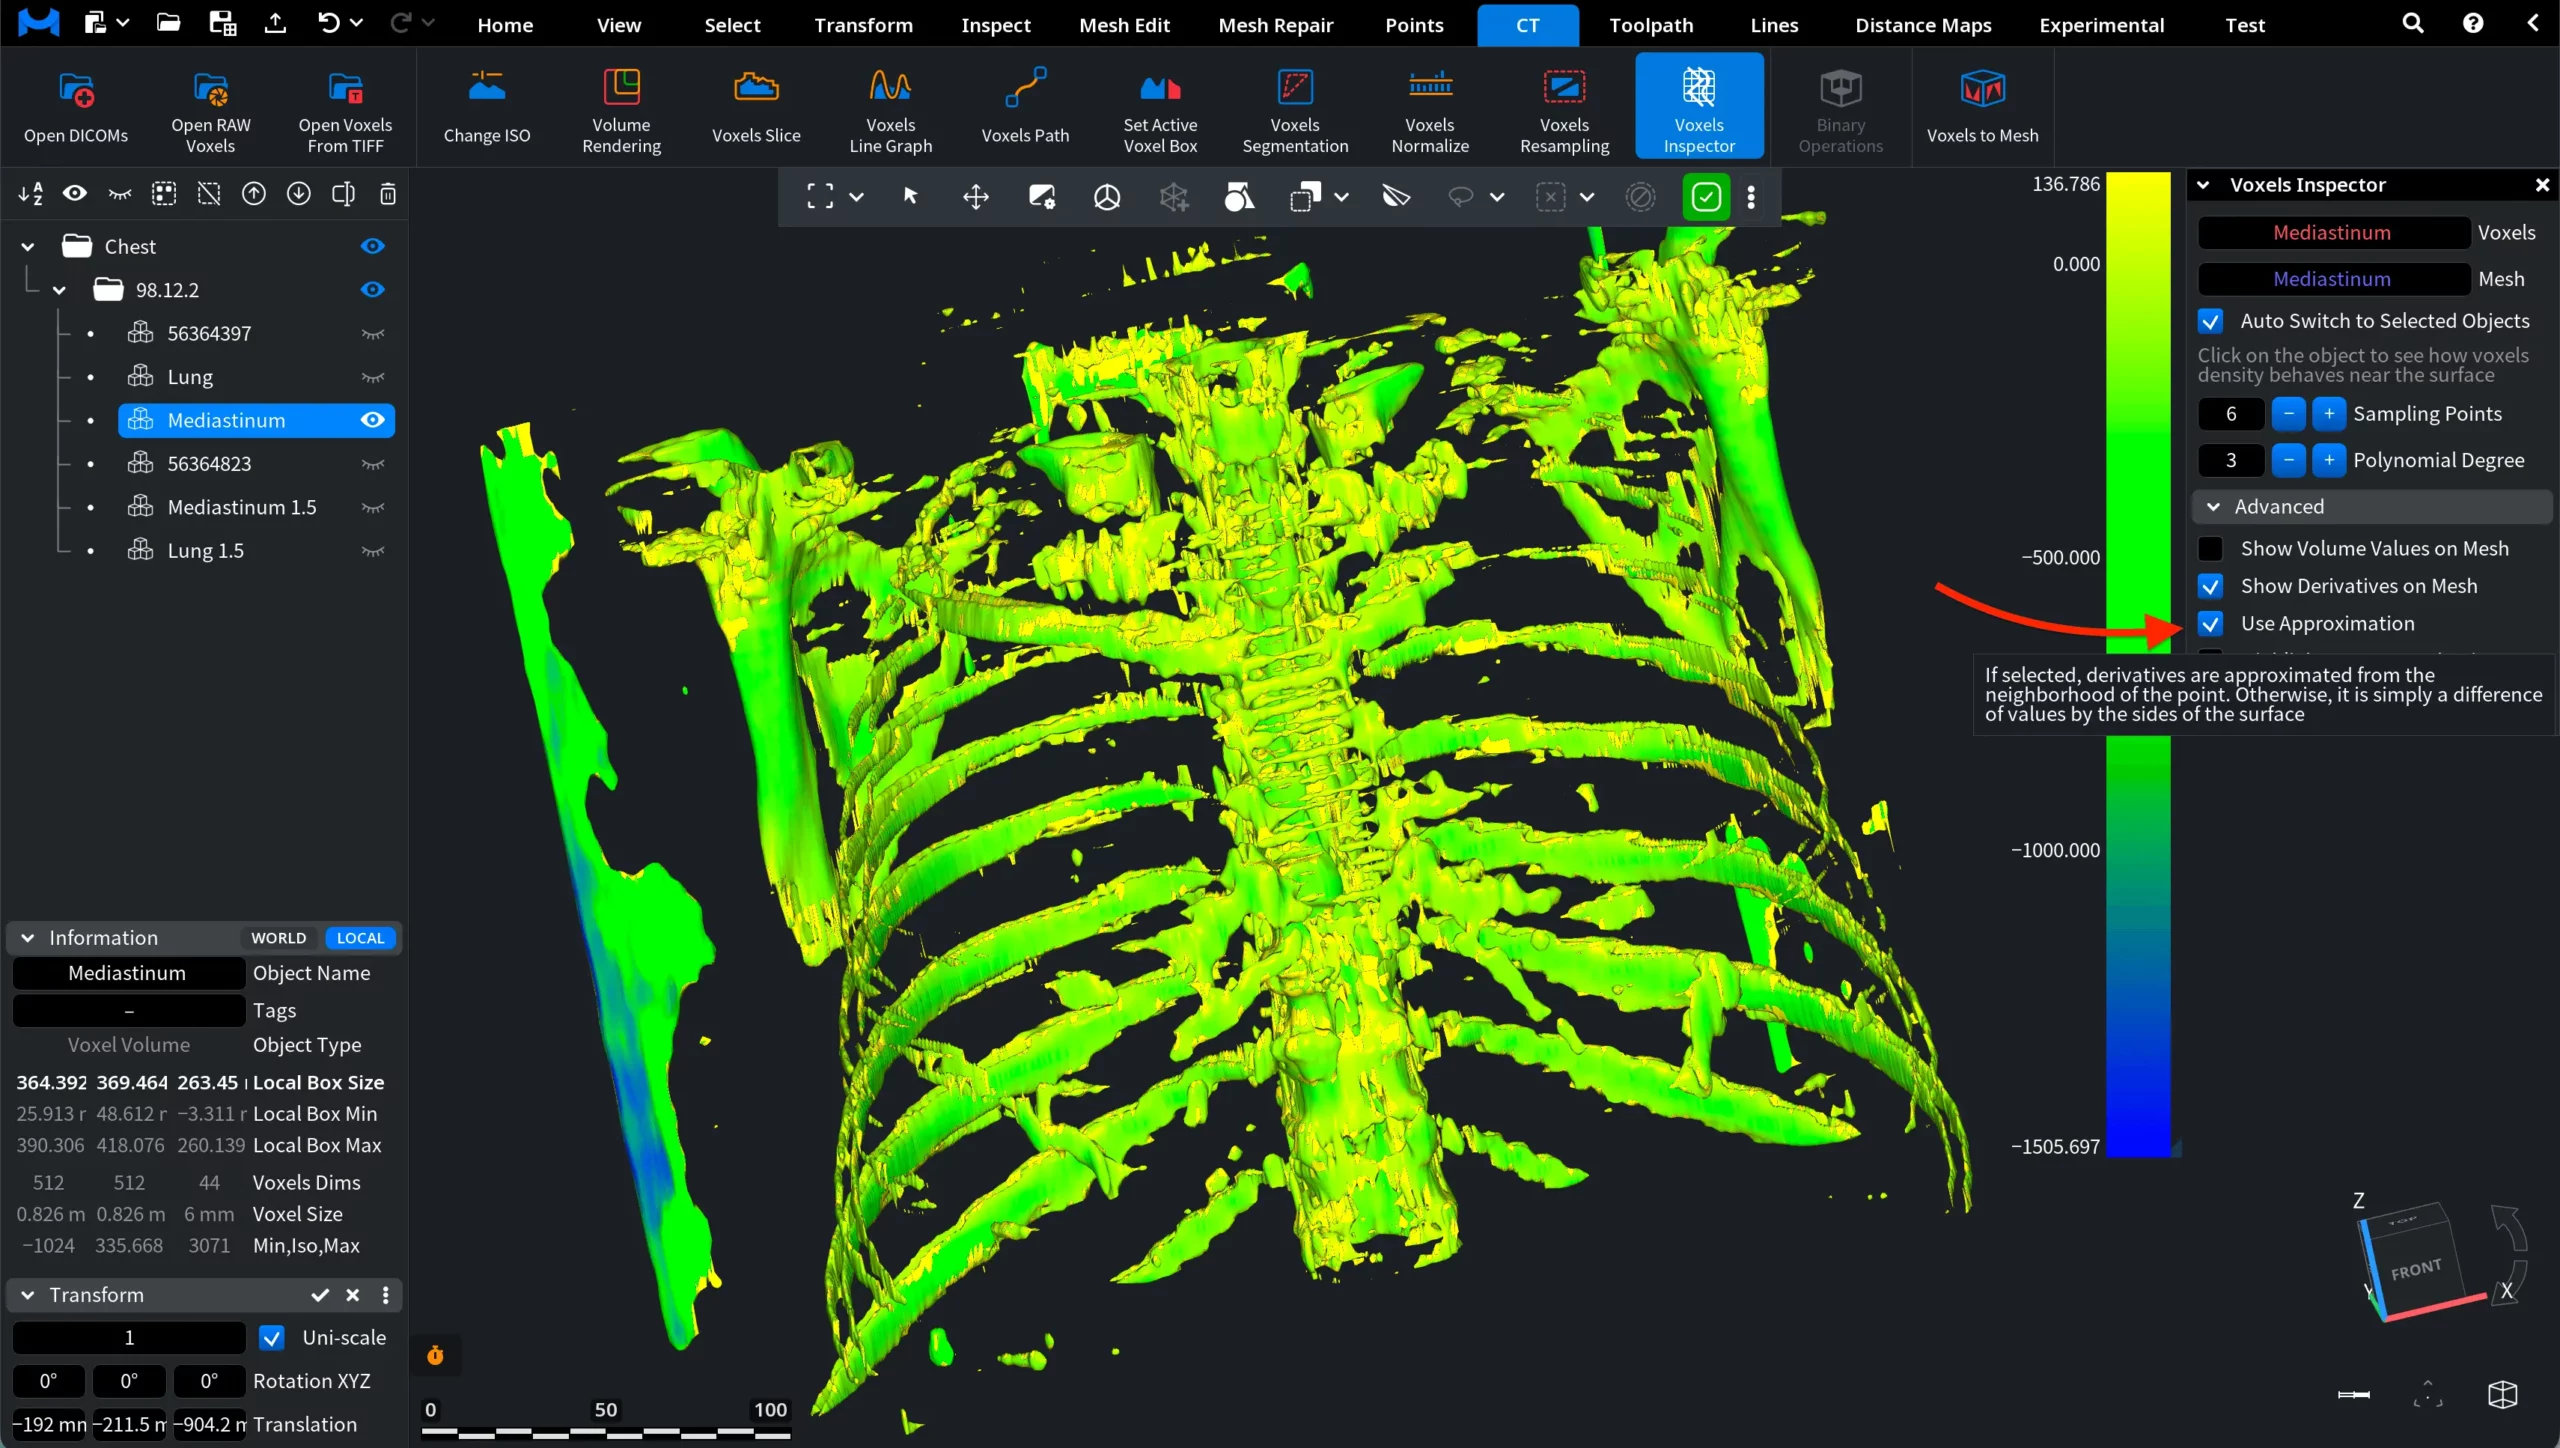
Below these fields, the Auto Switch to Selected Objects option determines whether the Voxels Inspector automatically updates when a different object is selected in the Scene Tree. When this option is enabled, selecting another voxel object in the Scene Tree automatically updates the Voxels field in the inspector.
For example, in the screenshot below, the object Mediastinum was selected, and the Voxels field switched to this dataset (the Mediastinum volume was made visible temporarily for demonstration purposes).
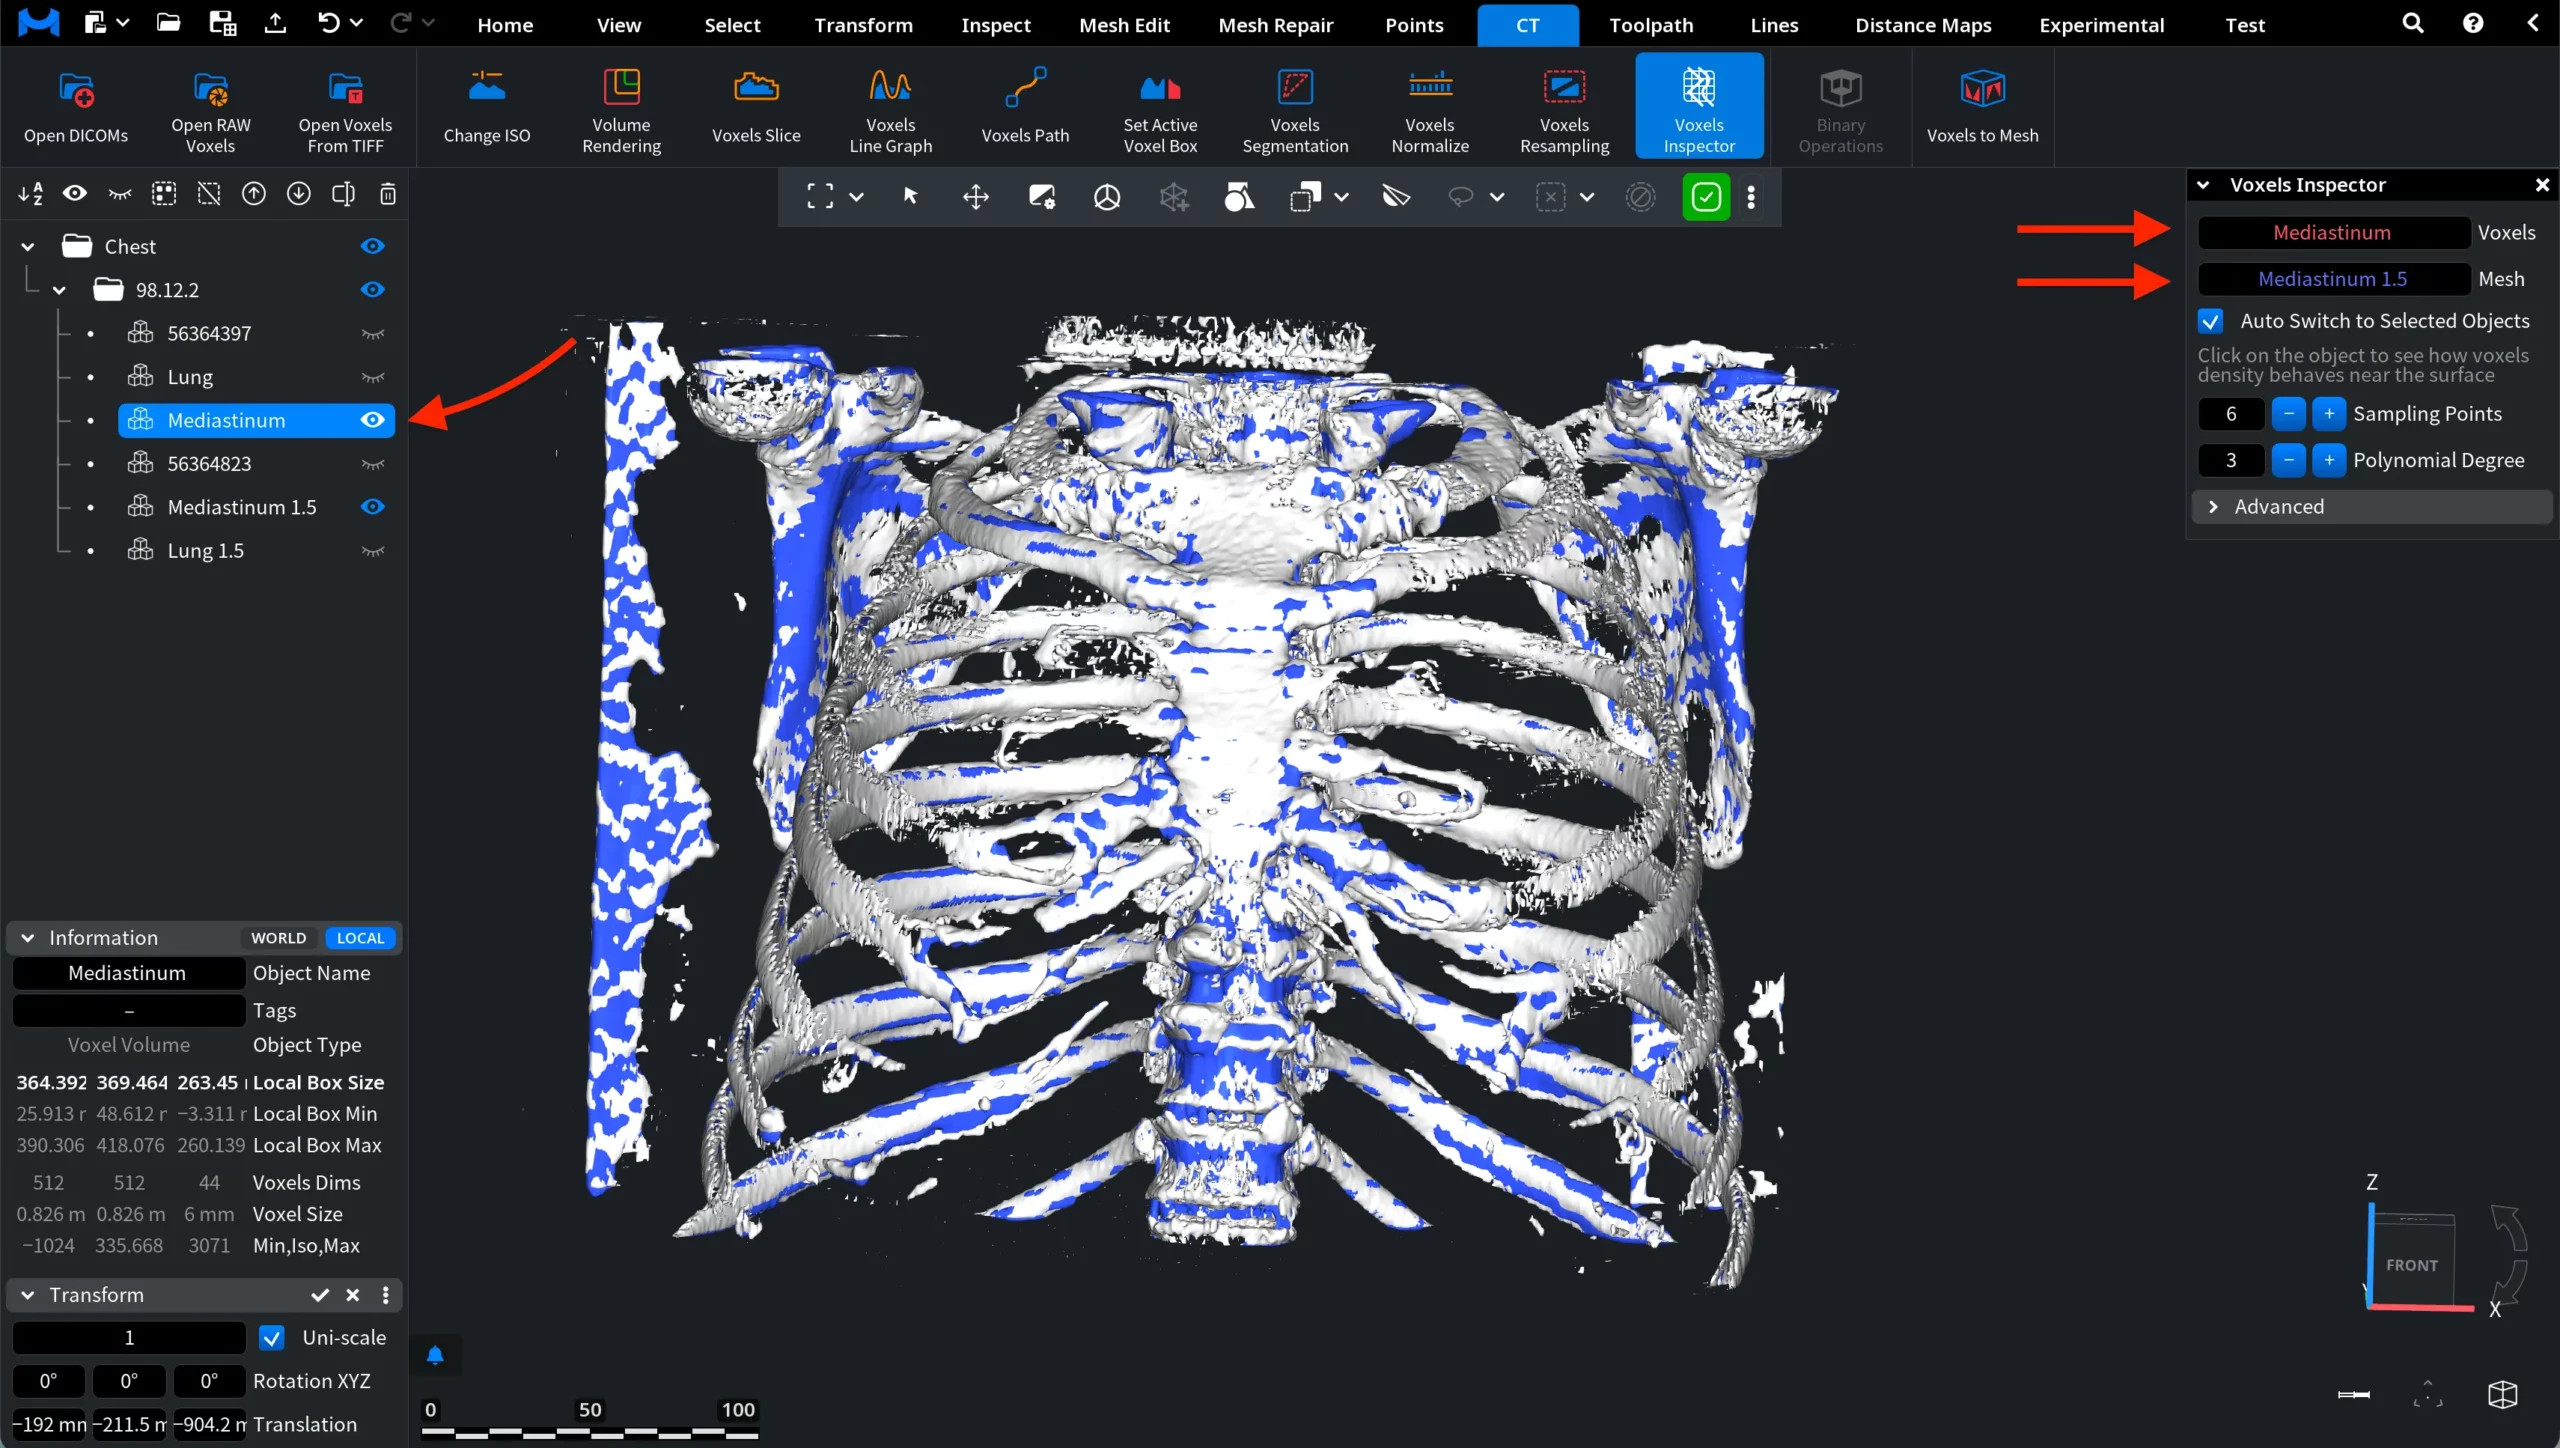
However, the Mesh field remains unchanged in this case. The mesh used for inspection acts as a surface reference and stays assigned even when the voxel dataset changes. That is, the mesh Mediastinum 1.5 continues to serve as the reference surface for analyzing voxel density. This allows users to inspect how voxel values from one dataset behave relative to the surface of another object if needed.
When you click on a point on the surface, the Voxels Inspector samples voxel values near that location and displays the results in a graph window. A small marker appears at the selected point, indicating the exact location used for sampling. The tool then analyzes voxel density in the direction normal to the surface and plots the sampled values.
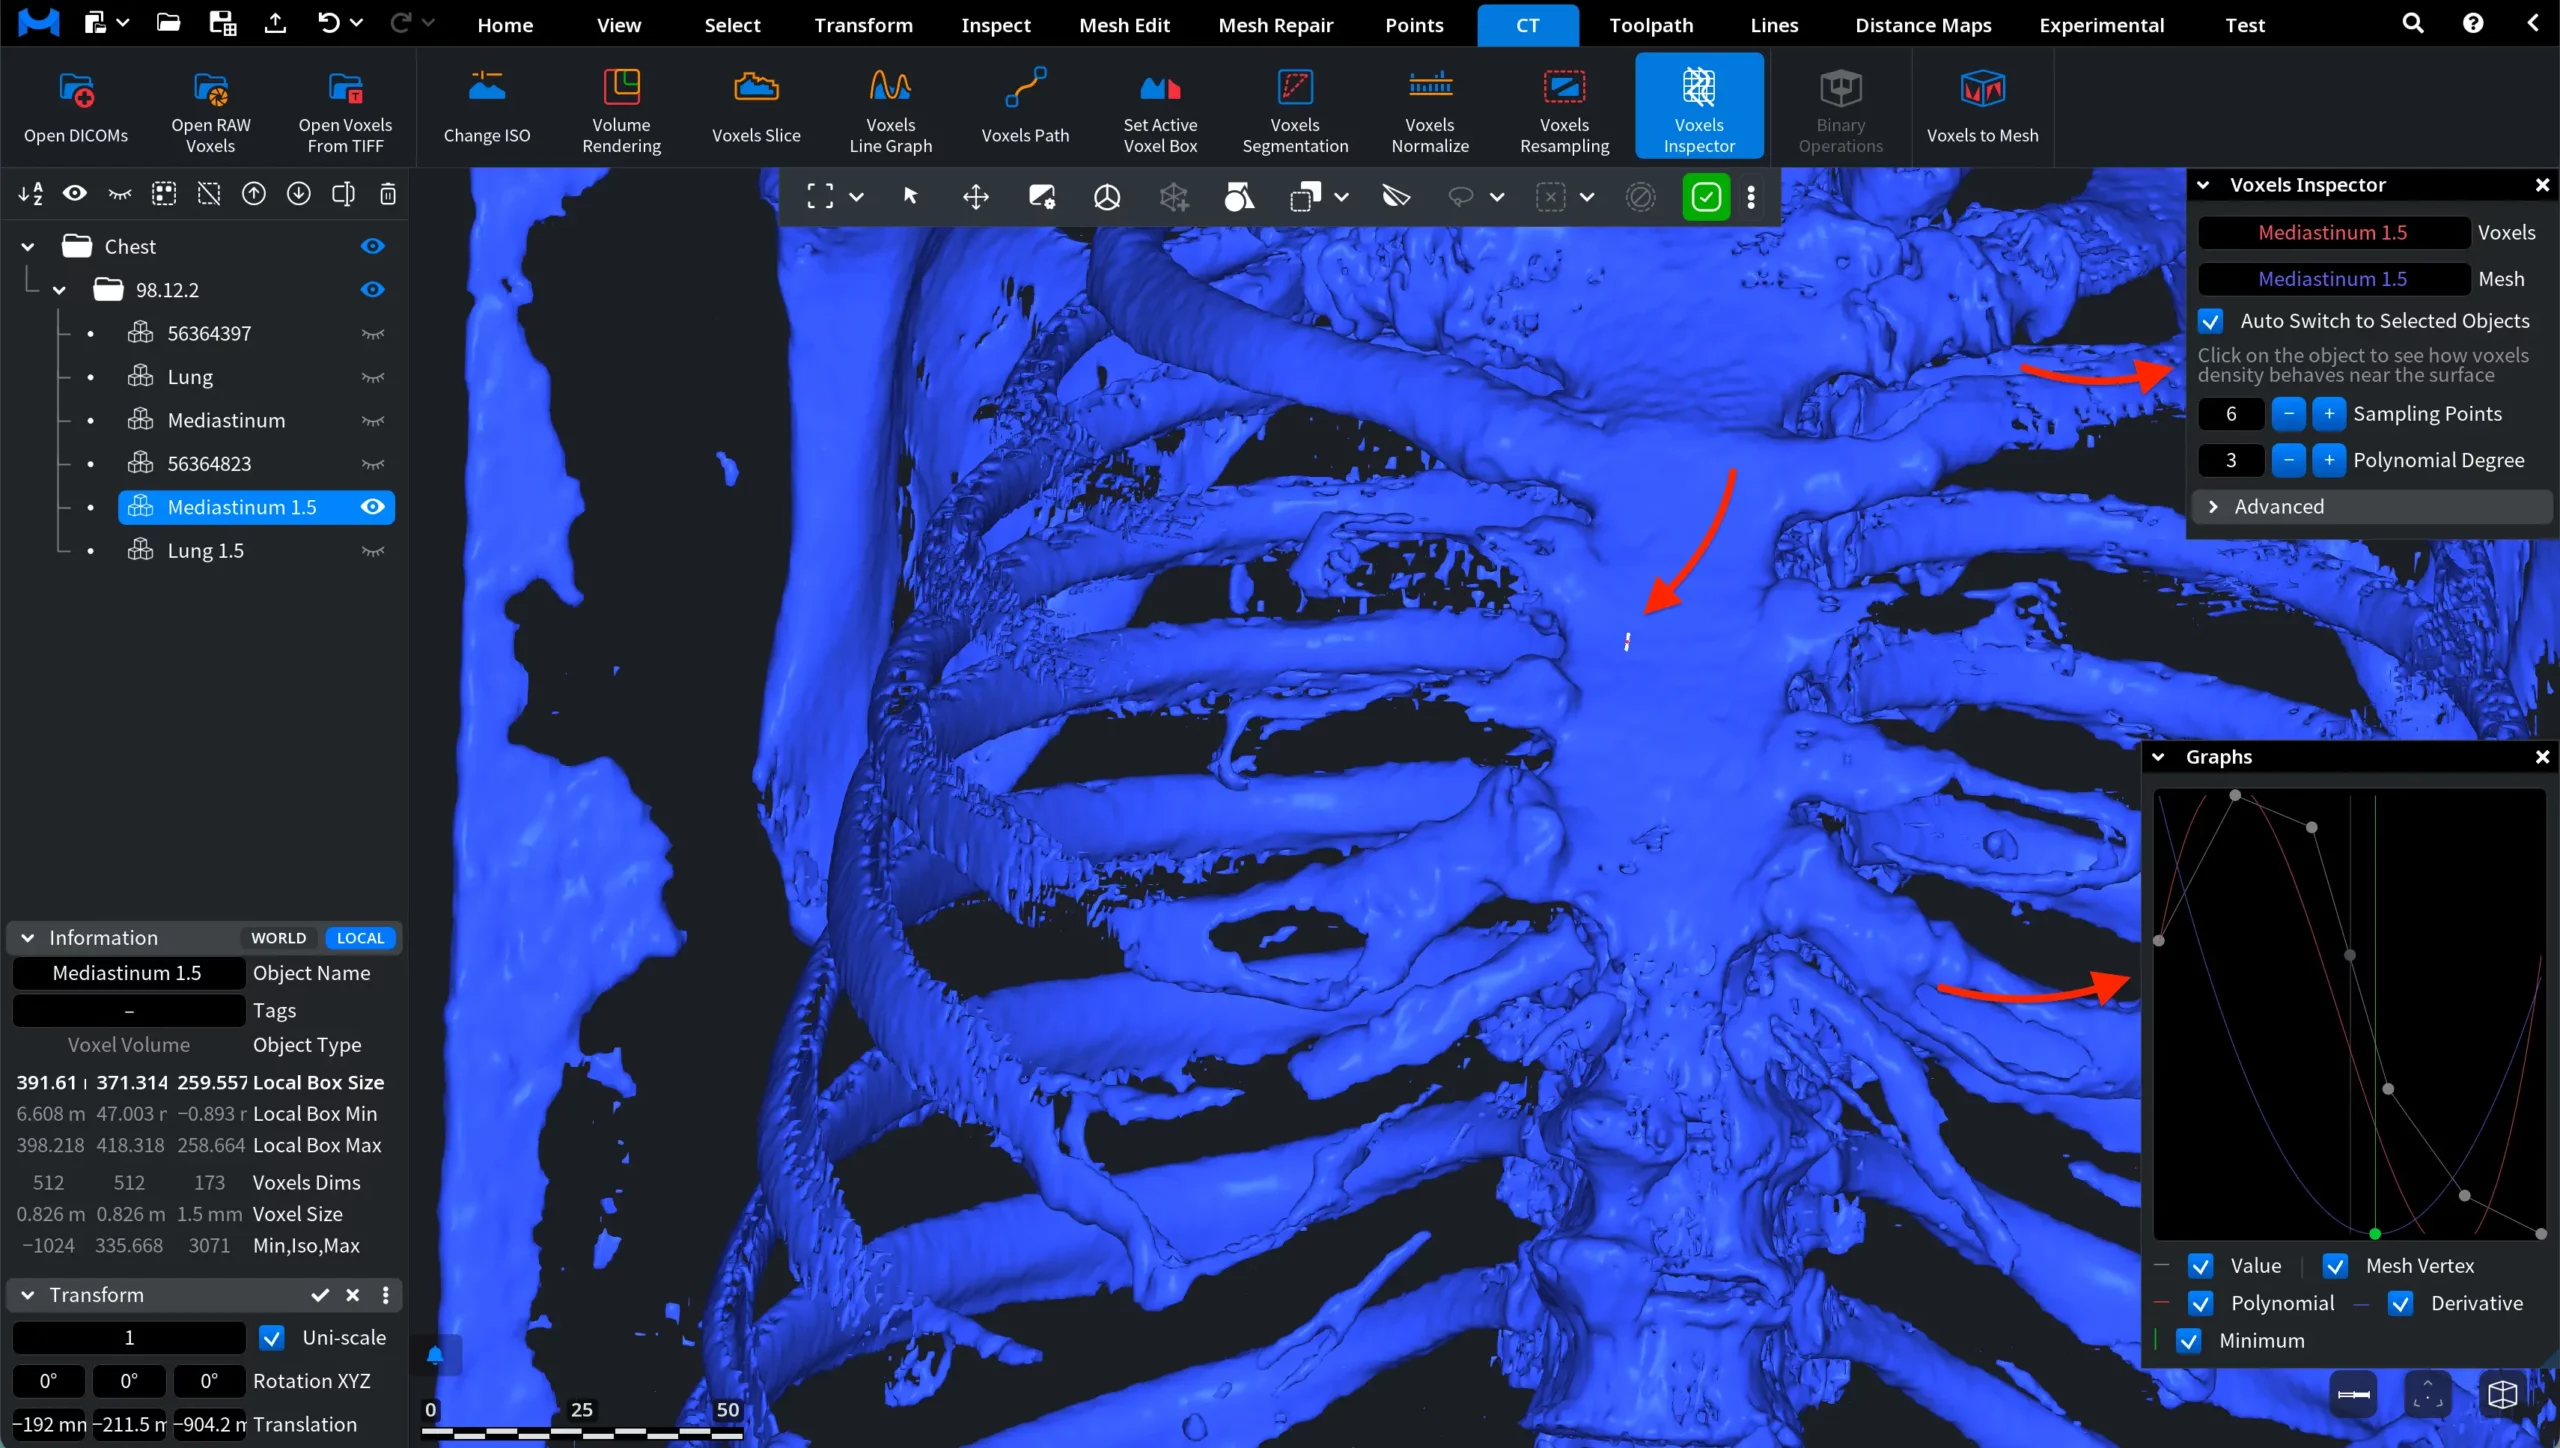
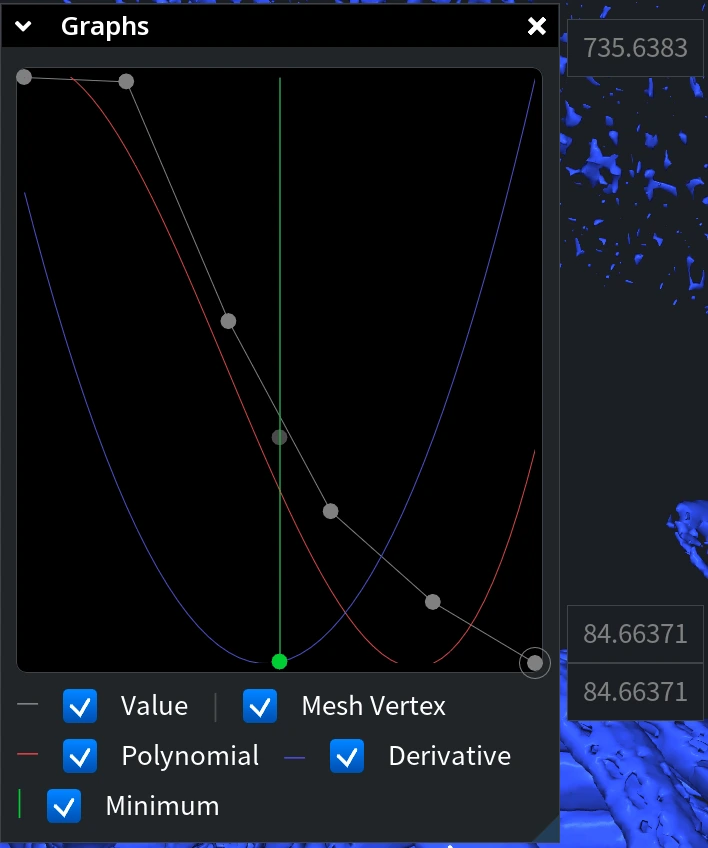
The Graphs window shows several curves that describe how voxel values change around the selected point:
- Value displays the raw voxel intensity values sampled near the selected point.
- Polynomial shows a polynomial approximation fitted to the sampled voxel values.
- Derivative displays the derivative of the polynomial approximation.
- Minimum marks the minimum of the polynomial curve.
- Mesh Vertex indicates the current position of the mesh surface used as the reference for sampling.
Together, these curves help visualize how voxel density behaves around the selected surface point and allow users to inspect gradients and surface positioning in the CT dataset. To better illustrate how the sampling works, the view can be zoomed in on the selected location. In the screenshot above, the camera is positioned close to the surface so that the sampling point becomes clearly visible. The small white marker indicates the exact point on the surface where the Voxels Inspector performs the analysis.
Around this marker, the tool samples voxel values along the direction normal to the surface. These sampled values are then used to build the curves displayed in the Graphs window. By zooming in, it becomes easier to see the exact position of the sampling point relative to the surrounding surface geometry and to understand how the voxel values correspond to the location shown in the graph.
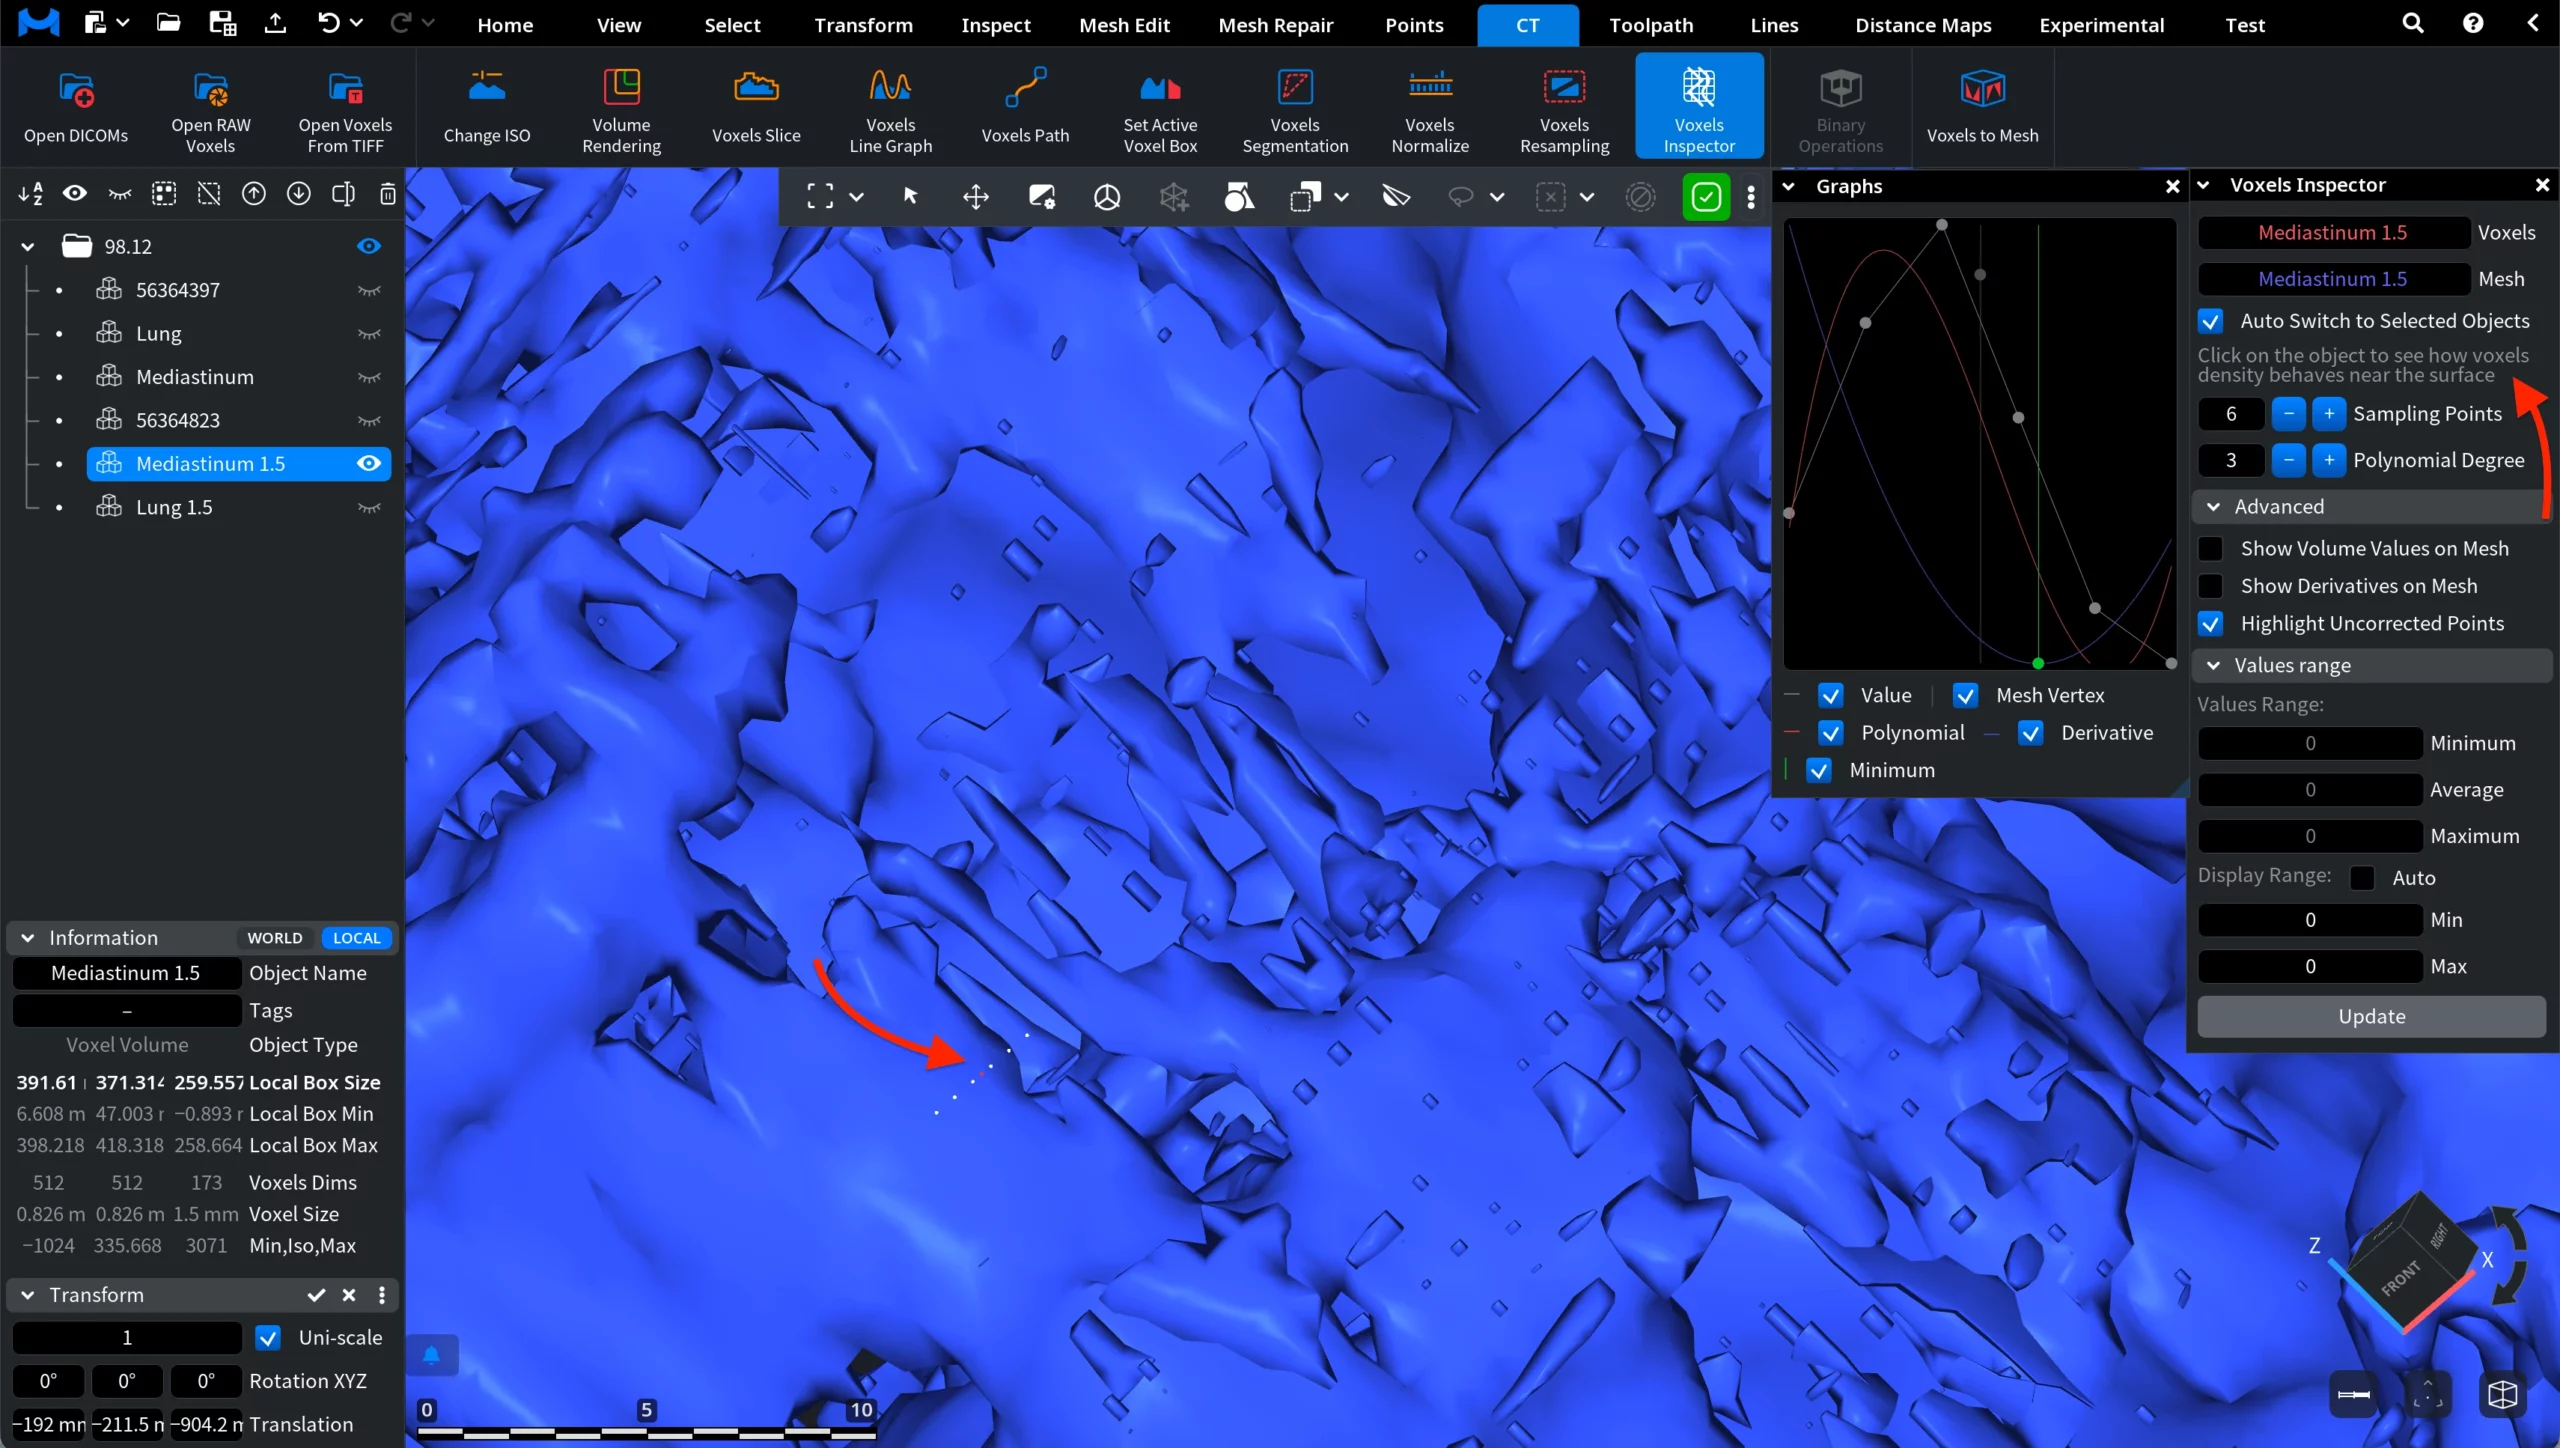
The behavior of the graph can be adjusted using the Sampling Points and Polynomial Degree parameters in the Voxels Inspector panel.
In the examples below, the same point on the surface remains selected. However, the graph changes after modifying these parameters because the tool recalculates how voxel values are sampled and approximated around that point.
- Sampling Points defines how many voxel samples are taken along the inspection direction near the selected surface point. Increasing this value means that more voxel values are collected for the analysis. As a result, the graph becomes more detailed because it is based on a larger number of sampled data points.
- Polynomial Degree specifies the degree of the polynomial used to fit the sampled voxel values. A higher polynomial degree produces a more flexible curve that can follow the sampled data more closely. Lower values result in a smoother and simpler approximation.
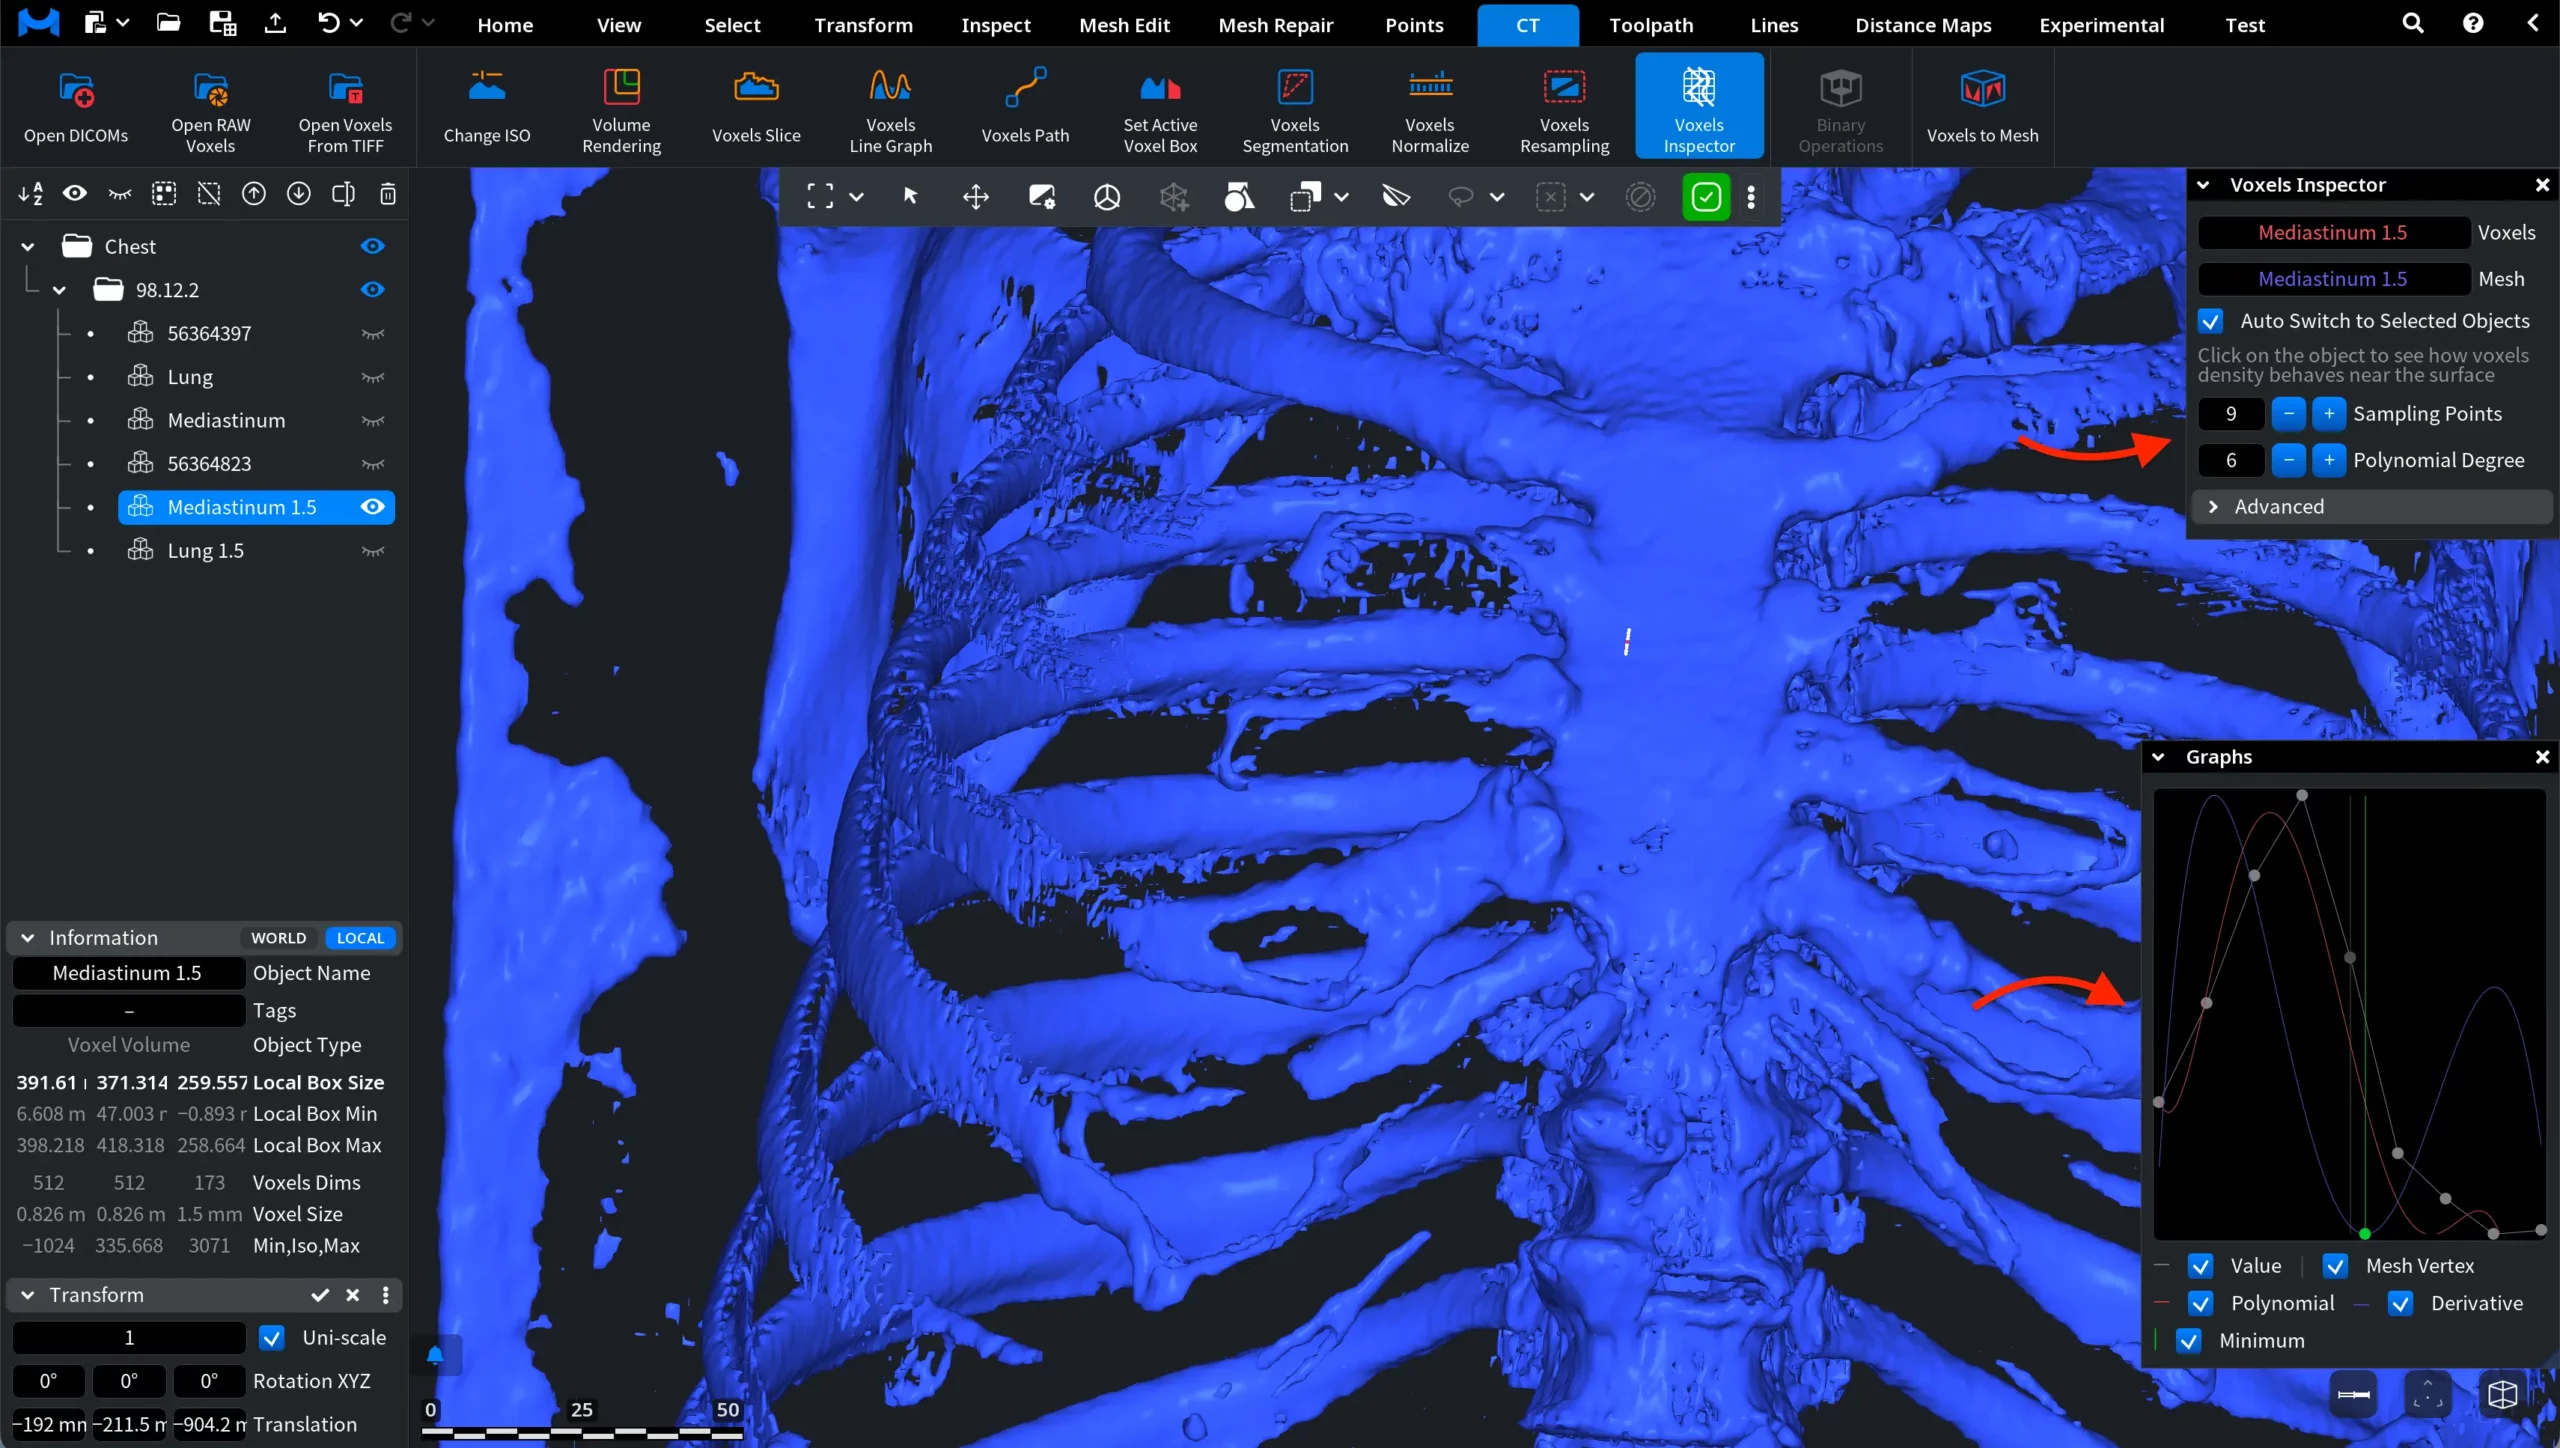
Note: the selected point on the surface did not move. Instead, the tool recomputed the sampled values and updated the Graphs window accordingly.
Advanced
The Advanced section provides additional visualization options for analyzing voxel values relative to the mesh surface.
Show Volume Values on Mesh
When this option is enabled, MeshInspector measures voxel values at the positions of mesh vertices and visualizes them directly on the mesh surface using a color scale. Each vertex of the mesh is assigned a color based on the voxel value sampled at that location. The resulting color map makes it possible to visually inspect how voxel values are distributed across the surface of the object.
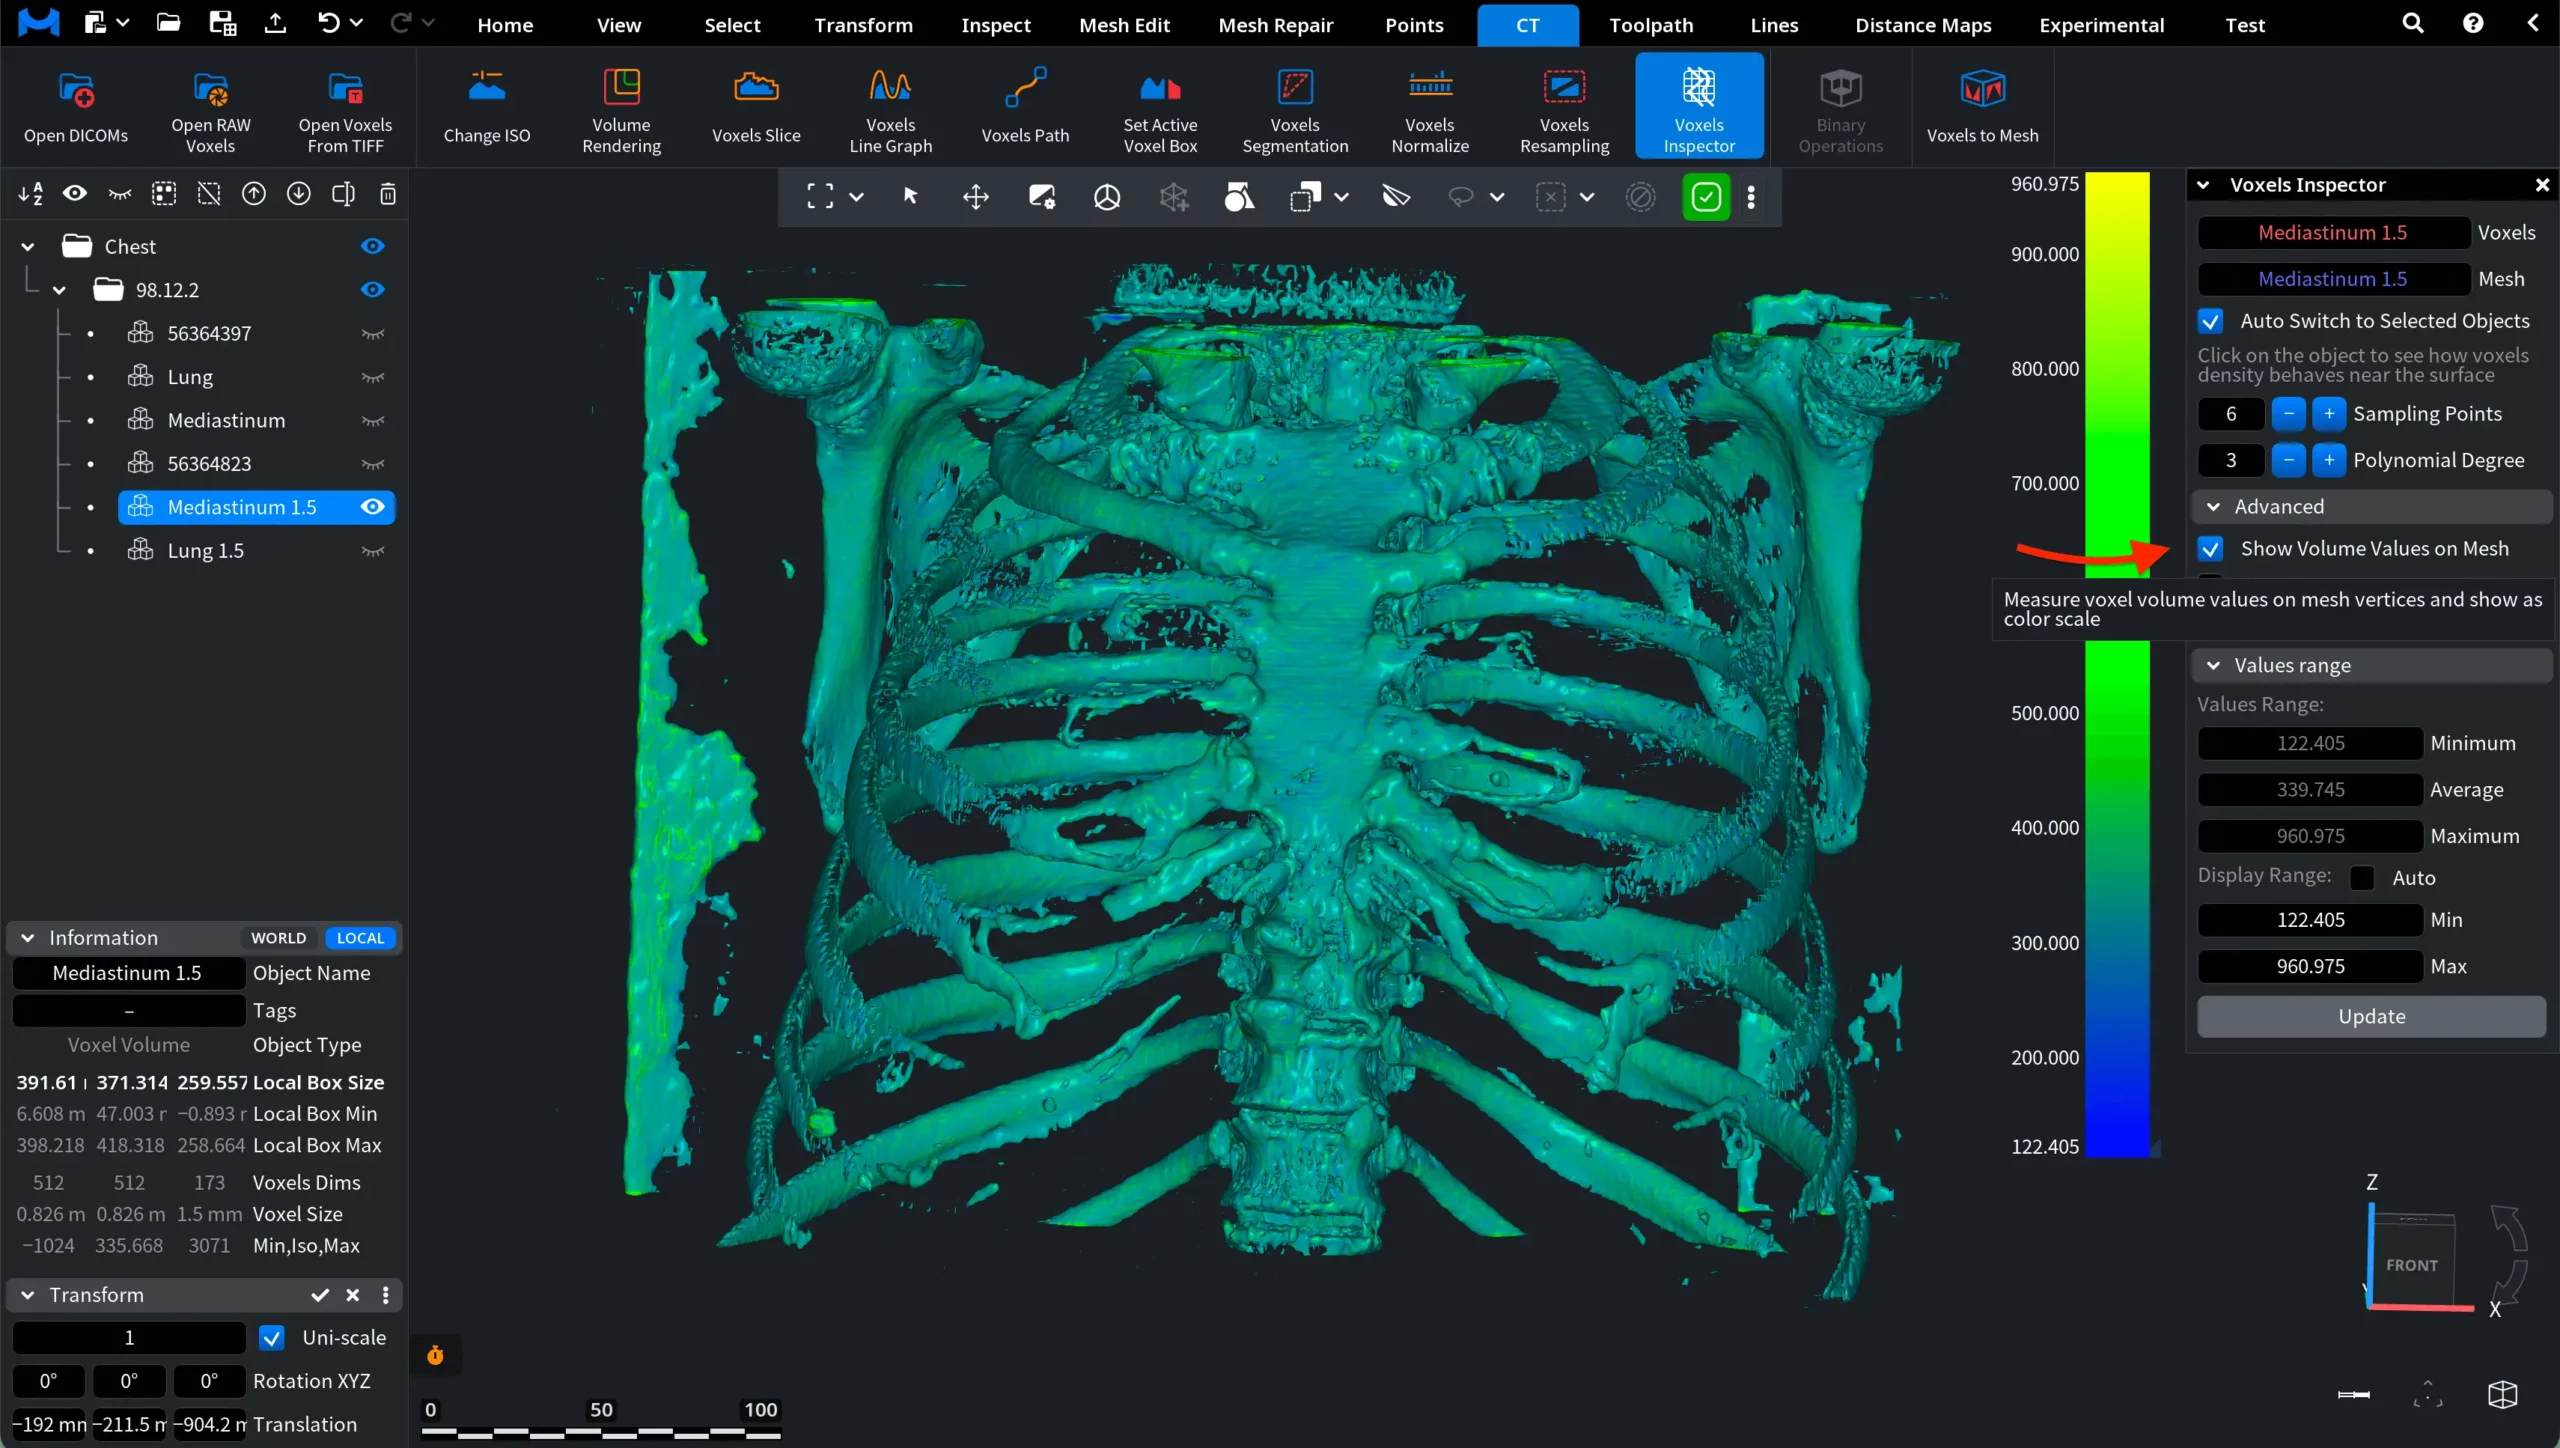
A vertical color scale appears in the viewport, indicating how colors correspond to voxel values. This allows users to quickly identify areas with higher or lower voxel intensities.
Show Derivatives on Mesh
When this option is enabled, MeshInspector measures the derivative of voxel values at the positions of mesh vertices and visualizes the result on the mesh surface using a color scale. Instead of displaying the voxel values themselves, this mode shows how rapidly voxel values change along the direction normal to the surface. In other words, it visualizes the local gradient of the voxel field near the mesh.
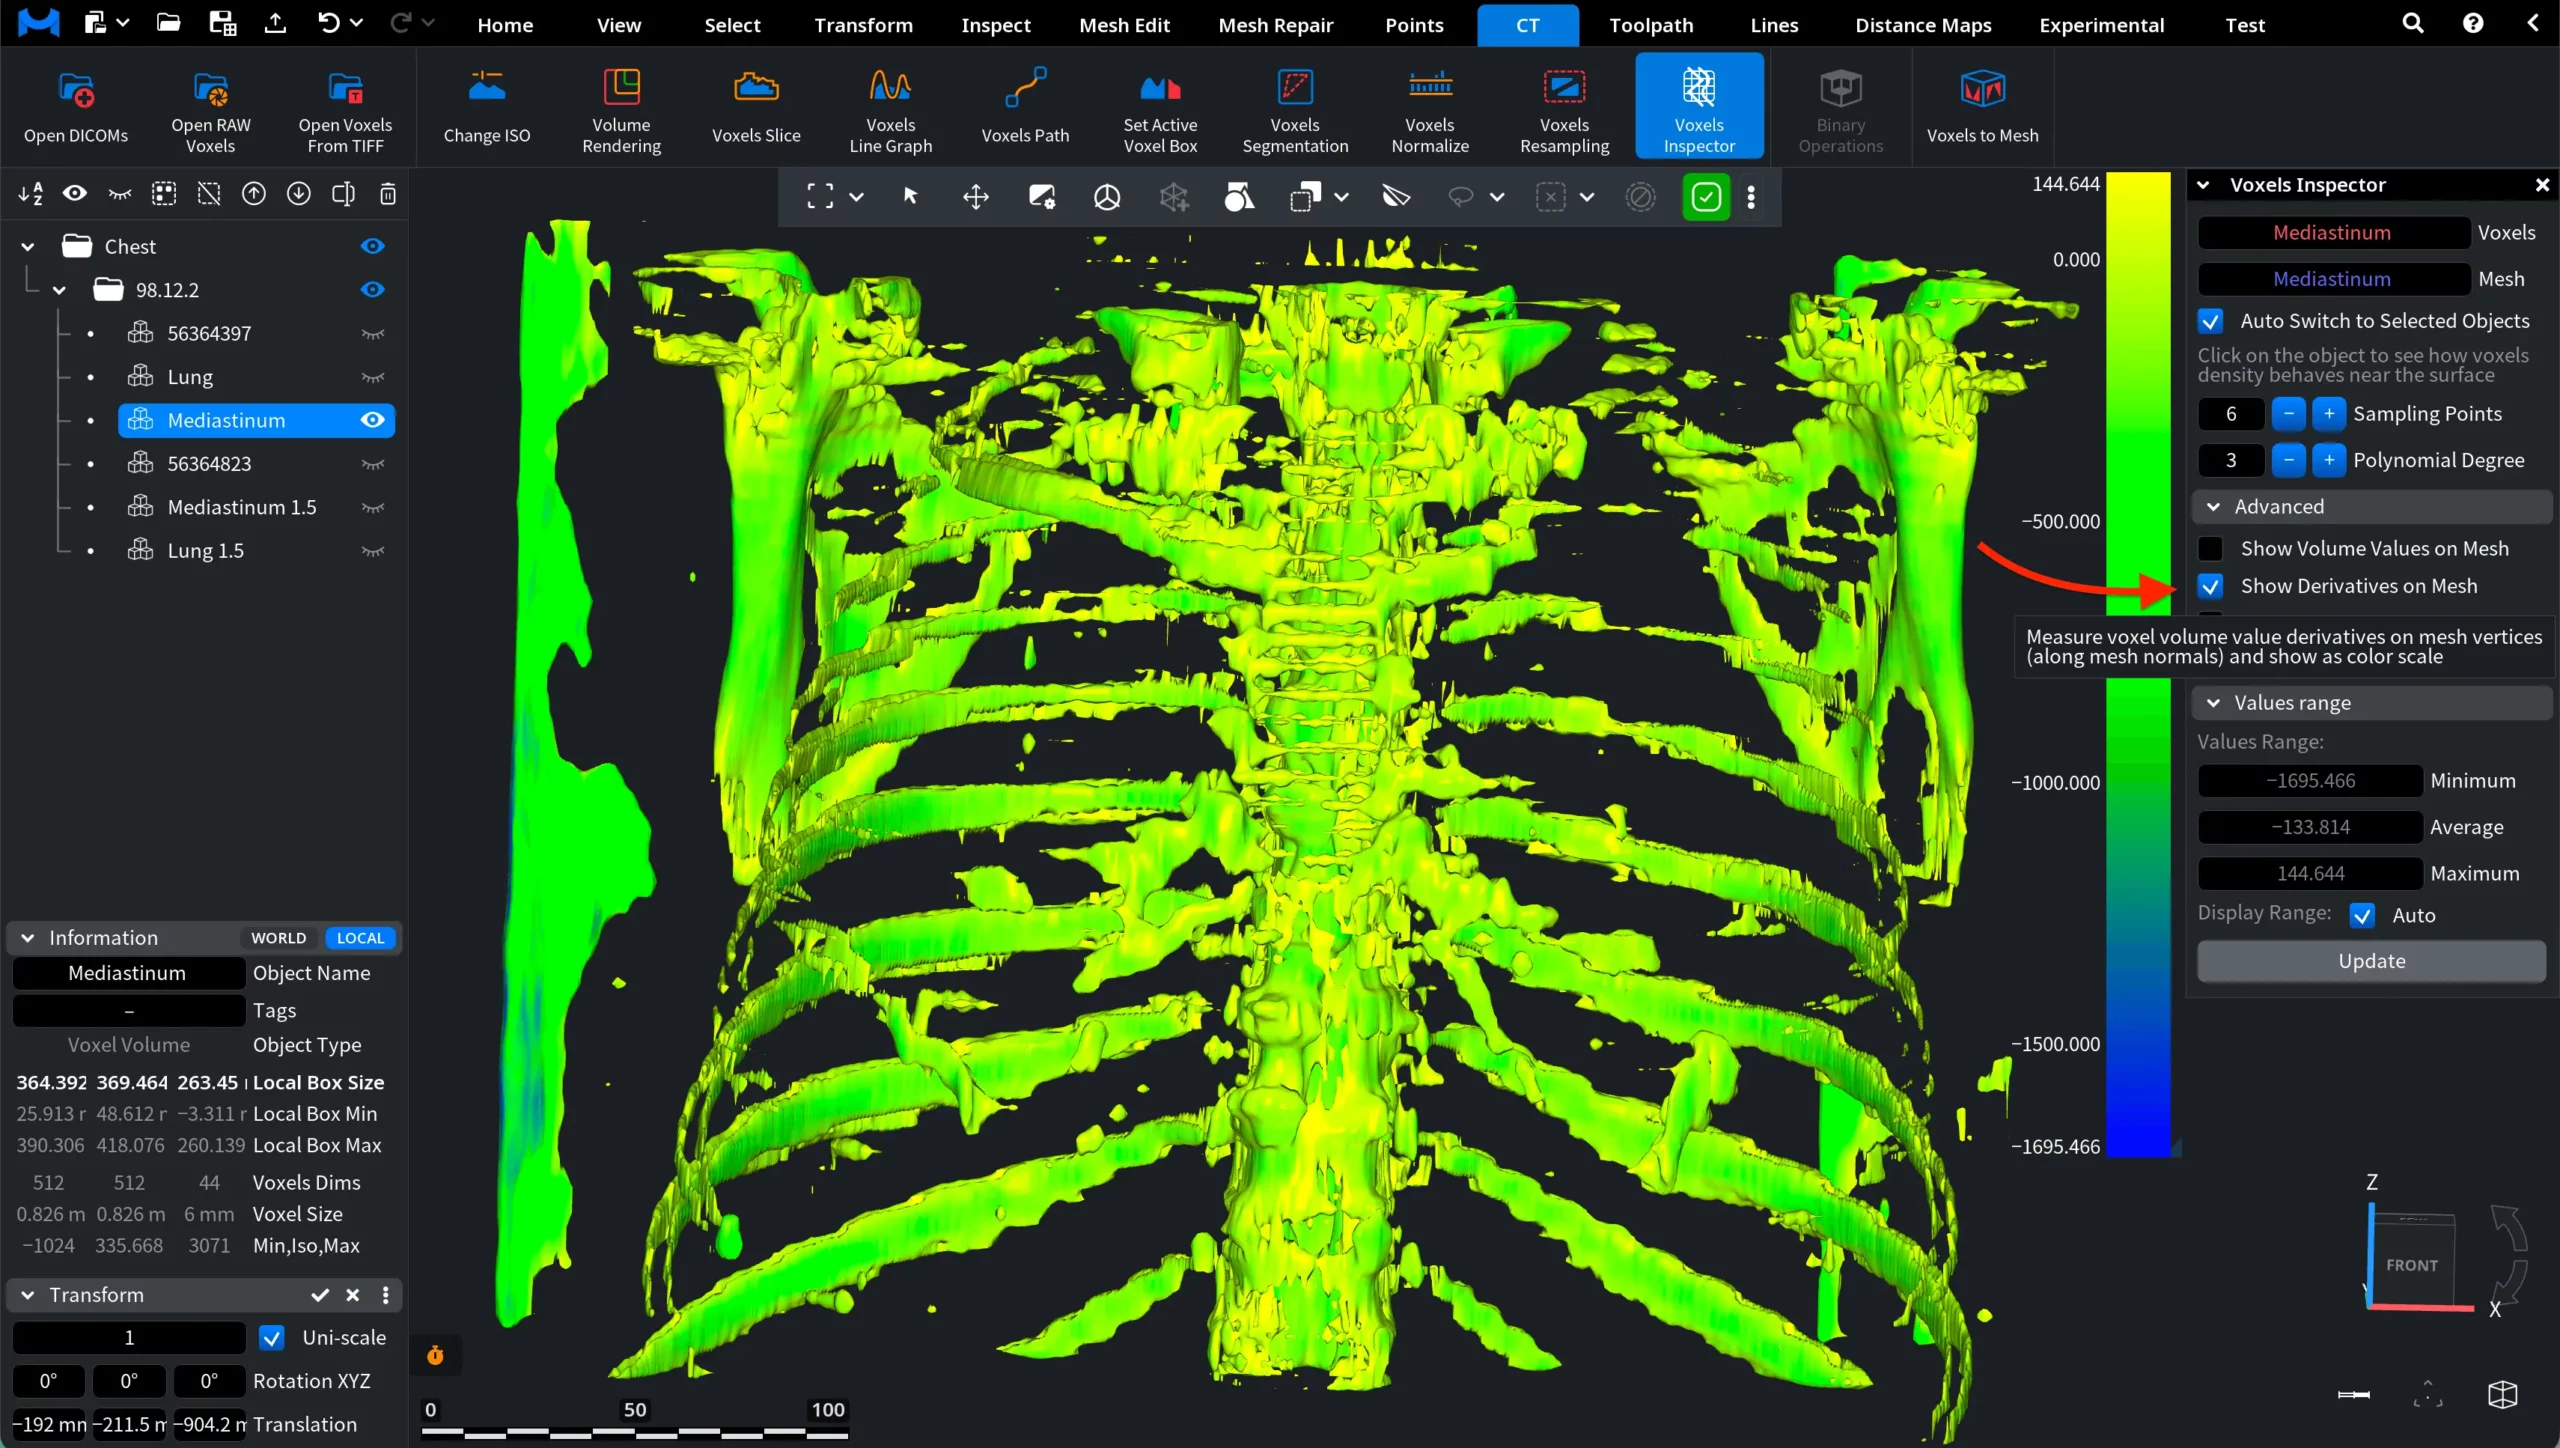
Each vertex of the mesh is colored according to the computed derivative value. The vertical color scale in the viewport indicates how colors correspond to derivative values.
Use Approximation
This option is available only when Show Derivatives on Mesh is enabled. When Use Approximation is selected, MeshInspector estimates the derivative of voxel values using a local approximation computed from neighboring samples around each mesh vertex. In this mode, the derivative is obtained from a fitted neighborhood rather than directly from the values immediately on the two sides of the surface.
Highlight Uncorrected Points
This option highlights mesh vertices where voxel-based surface correction could not be computed reliably.
Values Range
Values Range controls how voxel values are mapped to colors on the mesh surface. The panel displays three reference values derived from the voxel dataset:
- Minimum – the lowest value detected in the volume
- Average – the mean value across the dataset
- Maximum – the highest value detected in the volume
These values define the full range of voxel intensities present in the voxel volume. When voxel values are visualized on the mesh, the range is mapped to the color scale shown next to the panel. Lower values appear in blue, intermediate values appear in green, and higher values appear in yellow.
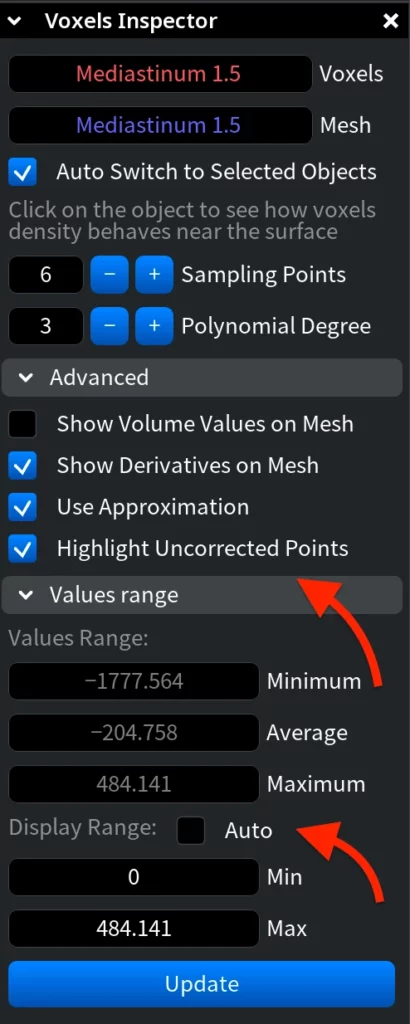
When Auto is enabled, MeshInspector automatically maps the entire voxel intensity range to the color scale. If Auto is disabled, users can manually specify the visualization interval using the Min and Max fields. In this case, only voxel values within the selected range are mapped to the color scale, allowing users to focus on a specific density interval in the dataset.
After modifying the values, click on Update to apply the new display range to the visualization.
How to Use the Voxels Inspector Tool