The G-code Visualizer, located under the Toolpath tab, allows you to visualize a CNC toolpath defined by G-code commands. The tool helps you inspect how the cutting tool is expected to move before using the toolpath in a machining workflow.

It is intended for three-axis CNC machine workflows, where G-code describes tool movements, including linear moves, arcs, positioning, and cutting passes.
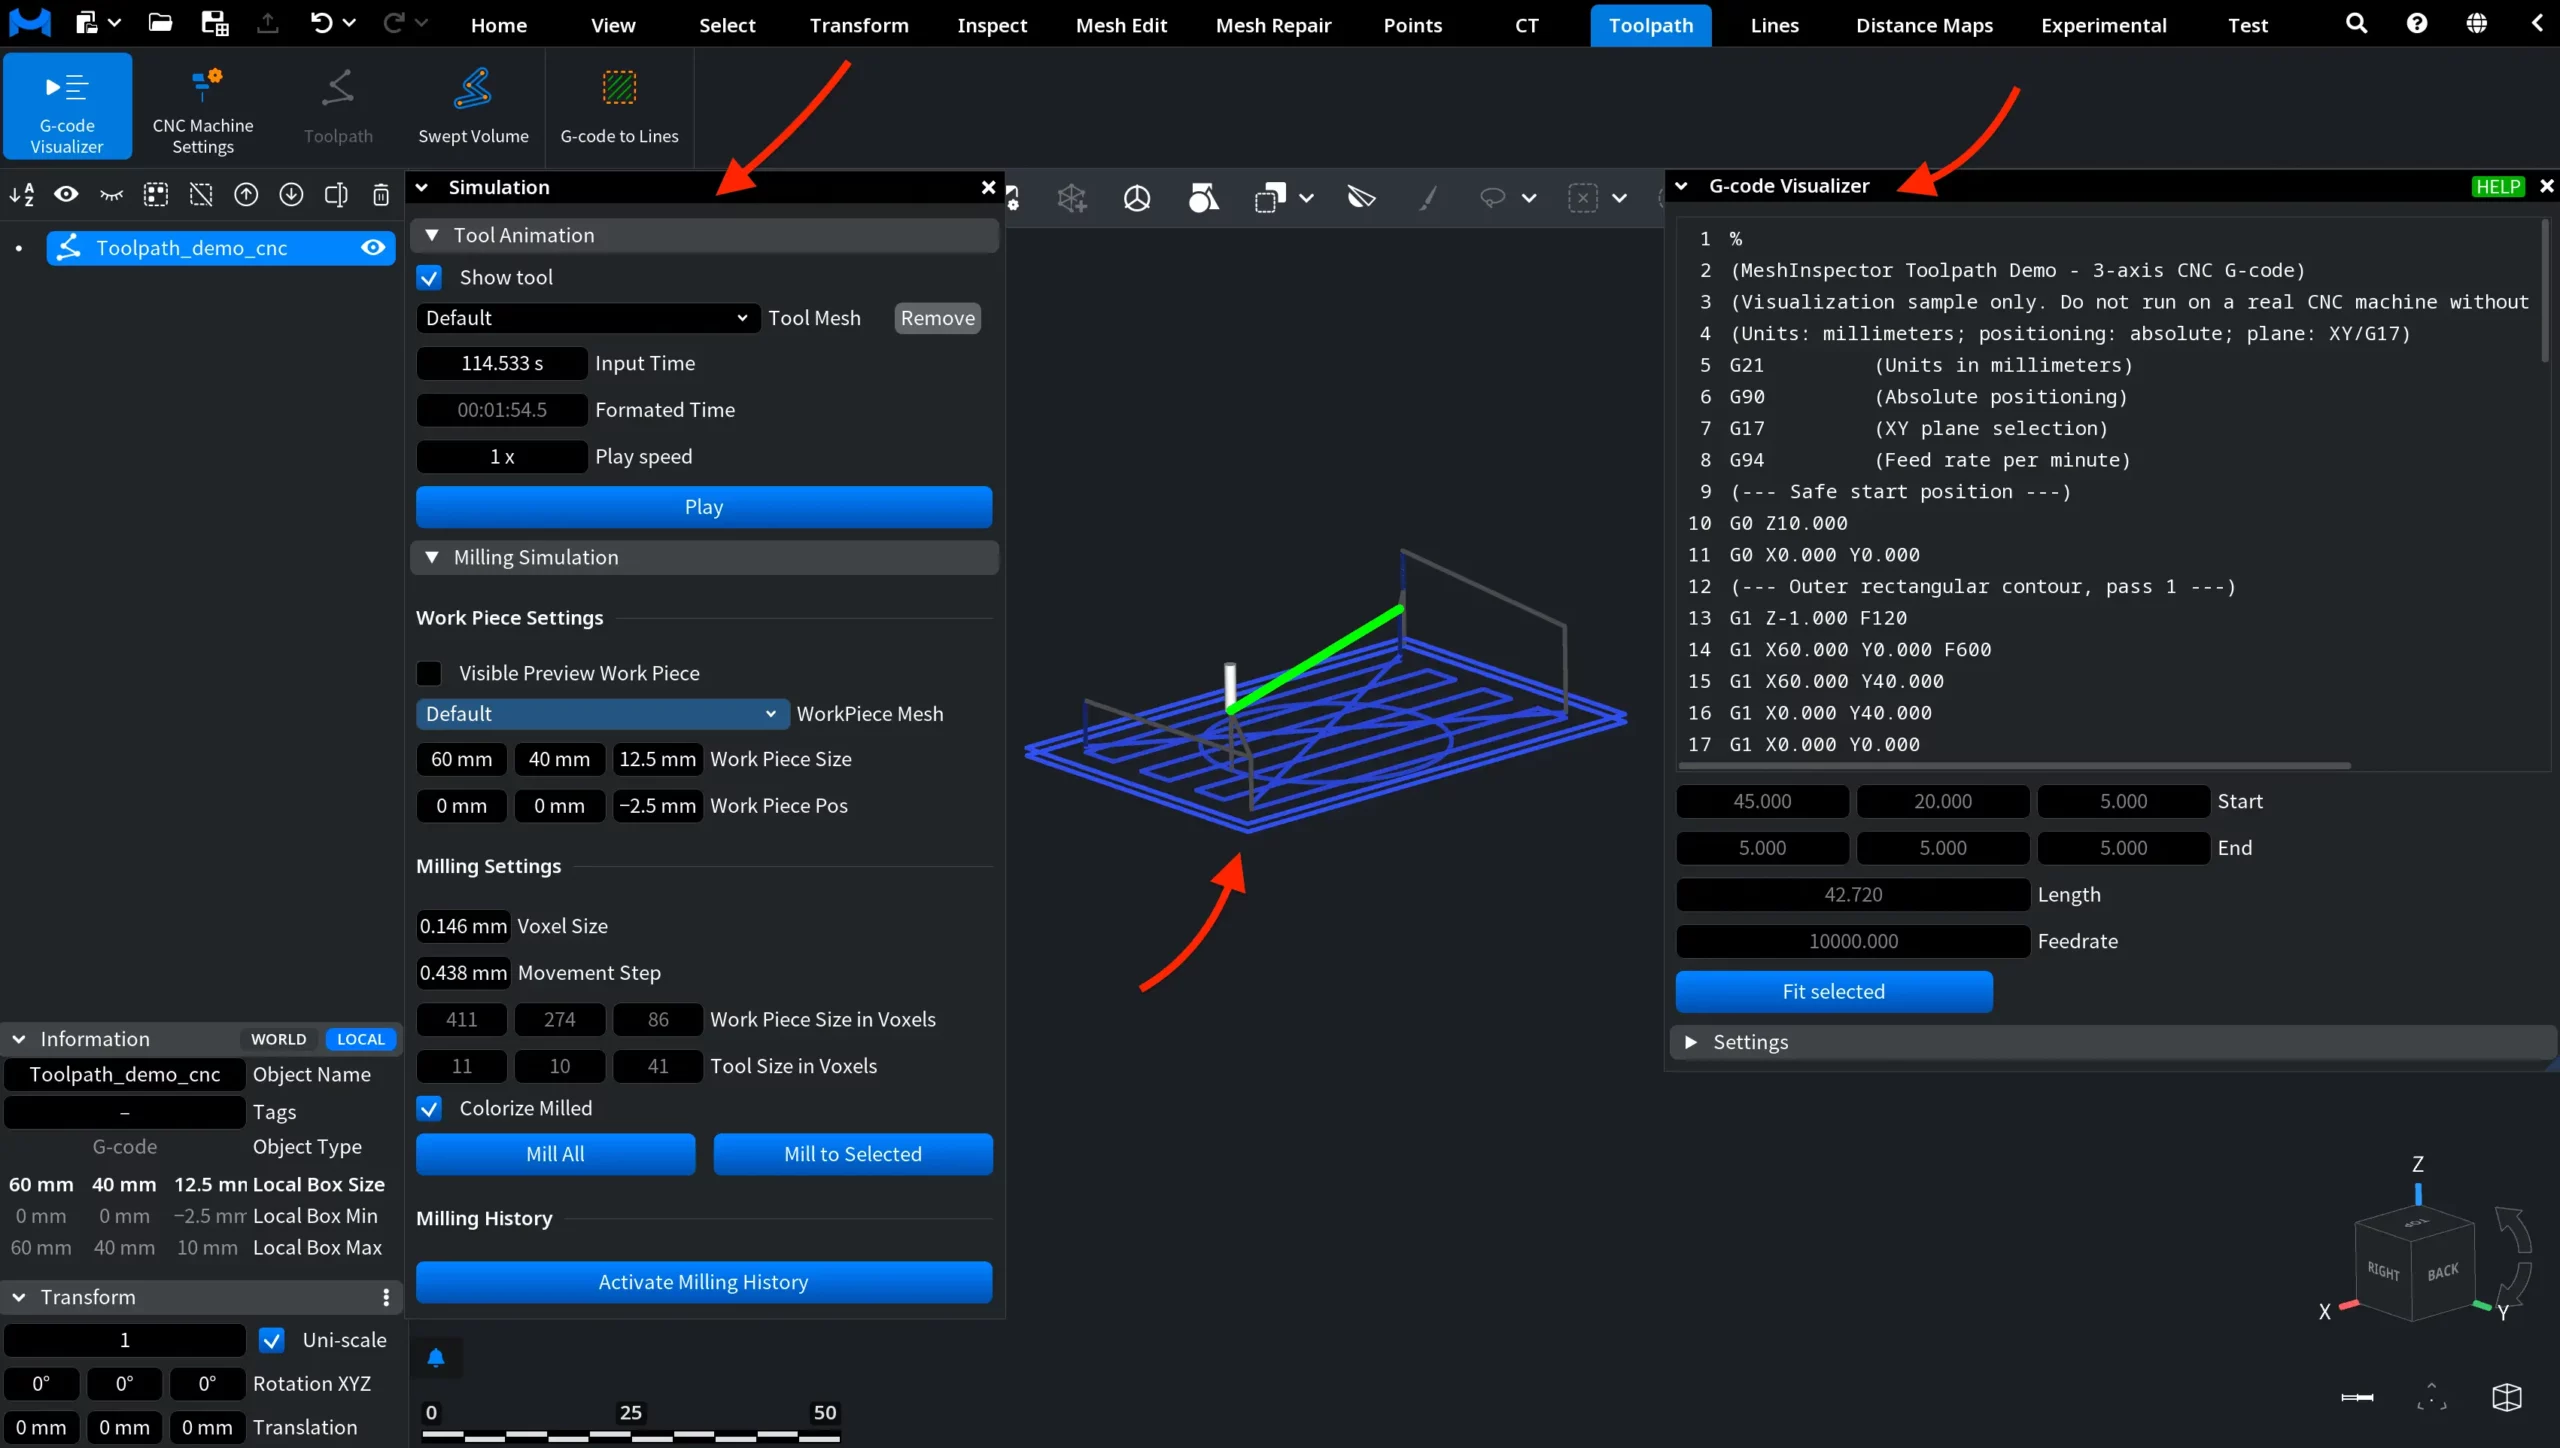
Once you click G-code Visualizer, MeshInspector opens two panels: Simulation and G-code Visualizer. The Simulation panel contains controls for previewing the tool movement and running the toolpath animation. It also includes milling simulation settings, which can be used to preview how the toolpath interacts with a workpiece. The G-code Visualizer panel shows the content of the selected G-code file and basic data about the selected toolpath movement.
G-code Visualizer
The G-code Visualizer panel shows the actual G-code commands as a sequence of numbered lines. It lets you inspect the file line by line and match each command with the corresponding movement in the viewport.
The full toolpath is displayed as a blue trajectory in the viewport. You can select a specific movement in two ways: by clicking the corresponding line in the G-code Visualizer panel or by clicking the movement directly in the viewport. Once selected, the movement is highlighted, making it easier to match a G-code command with its visual representation.
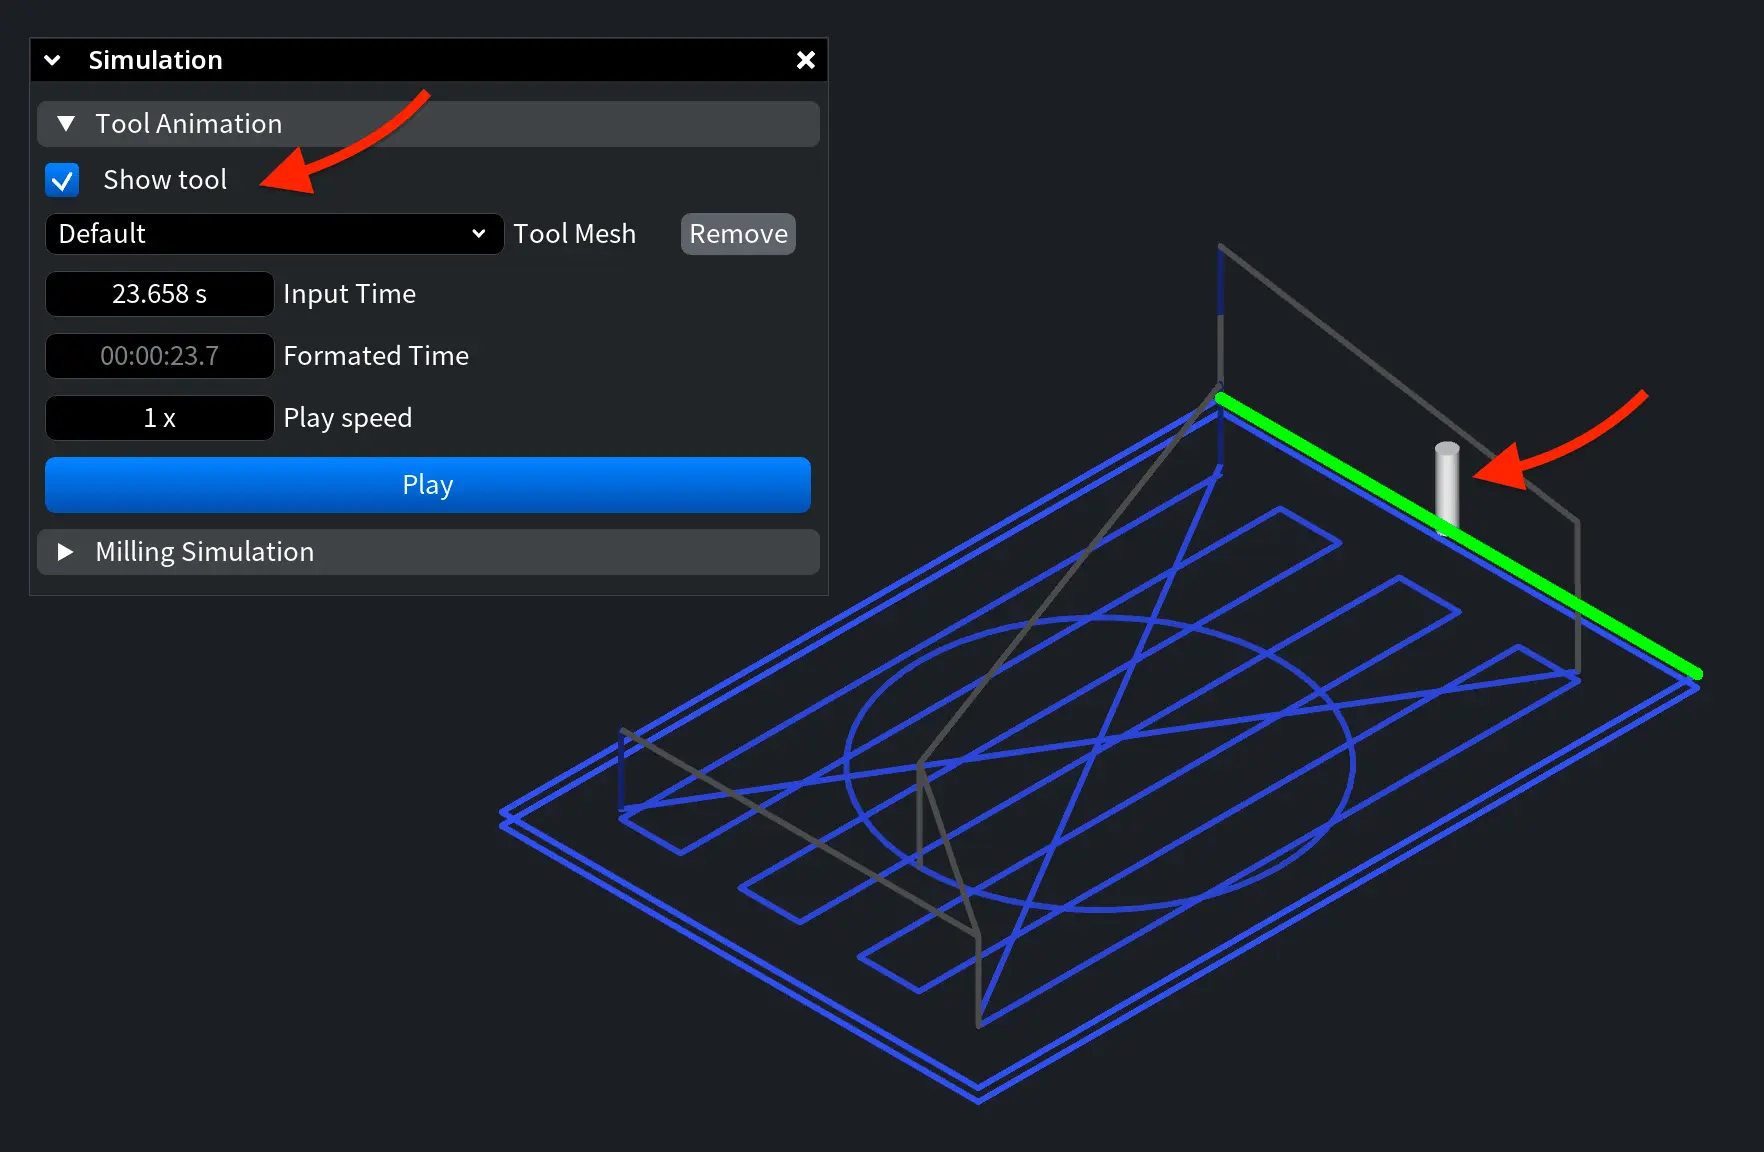
The white cylinder represents the CNC tool. It shows the tool position for the selected command or simulation step and helps you understand where the cutter is located relative to the toolpath.
Below the G-code list, the panel displays basic information about the selected movement, when applicable:
- Start shows the starting coordinates of the selected movement.
- End shows the ending coordinates of the selected movement.
- Length shows the distance covered by the selected movement.
- Feedrate shows the movement speed defined for the selected command.
- Error displays error-related information if an issue is detected and error data is available.
Click Fit selected to center the selected movement in the viewport. This button is available when a selectable toolpath movement is selected.
Settings
The Settings section controls how the toolpath is displayed and selected in the viewport.
Line Width defines the thickness of the toolpath lines.
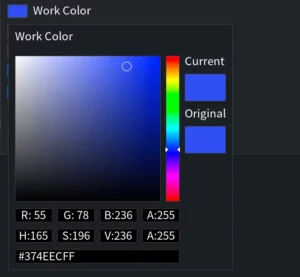
The color fields define how different parts of the toolpath are displayed. To change a color, click the colored field next to the corresponding option. In the color picker, select a new shade manually or enter exact color values. The Current field shows the selected color, while Original shows the default one.
- Work Color is used for the main toolpath.
- Selected Color is used for the currently selected movement.
- Highlighted Color is used when a movement is highlighted.
You can also:
- Enable Feedrate as Gradient.
- Enable Search Closest by Screen.
- Adjust Accuracy.
- Enable Show Error.
Simulation
The Simulation panel is used to preview how the selected CNC tool moves along the G-code toolpath.
Tool Animation
The Tool Animation section controls how the CNC tool is displayed and animated in the viewport.
- Show tool displays or hides the tool in the viewport. When enabled, the tool is shown as a white cylinder or as the selected tool mesh.
- Tool Mesh allows you to choose the tool model used for the animation.
- Remove removes the selected tool mesh from the tool animation.
- Input Time shows the current playback position in seconds.
- Formatted Time shows the current playback position in a more readable time format.
- Play speed controls how fast the animation is played.
- Play/Pause starts or pauses the tool animation.
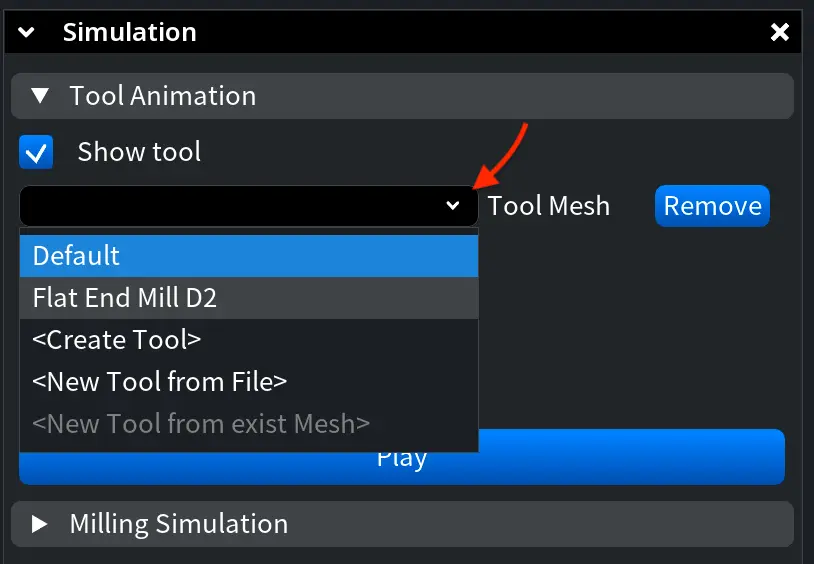
To select or create a tool mesh, open the Tool Mesh dropdown. You can:
- Use the Default tool.
- Select one of the already created tools, if available, such as Flat End Mill D2.
- Select Create Tool to create a simple tool directly in MeshInspector.
- Select New Tool from File to load a tool model from a file.
- Select New Tool from exist Mesh if a suitable mesh object is available.
When you select Create Tool, MeshInspector opens the Create Tool window. Here, you can specify:
- Name is the tool name;
- Type is the tool type, e.g., Flat End Mill, Ball End Mill, Bull Nose End Mill, or Chamfer End Mill;
- Length is the tool length;
- Diameter is the tool diameter.
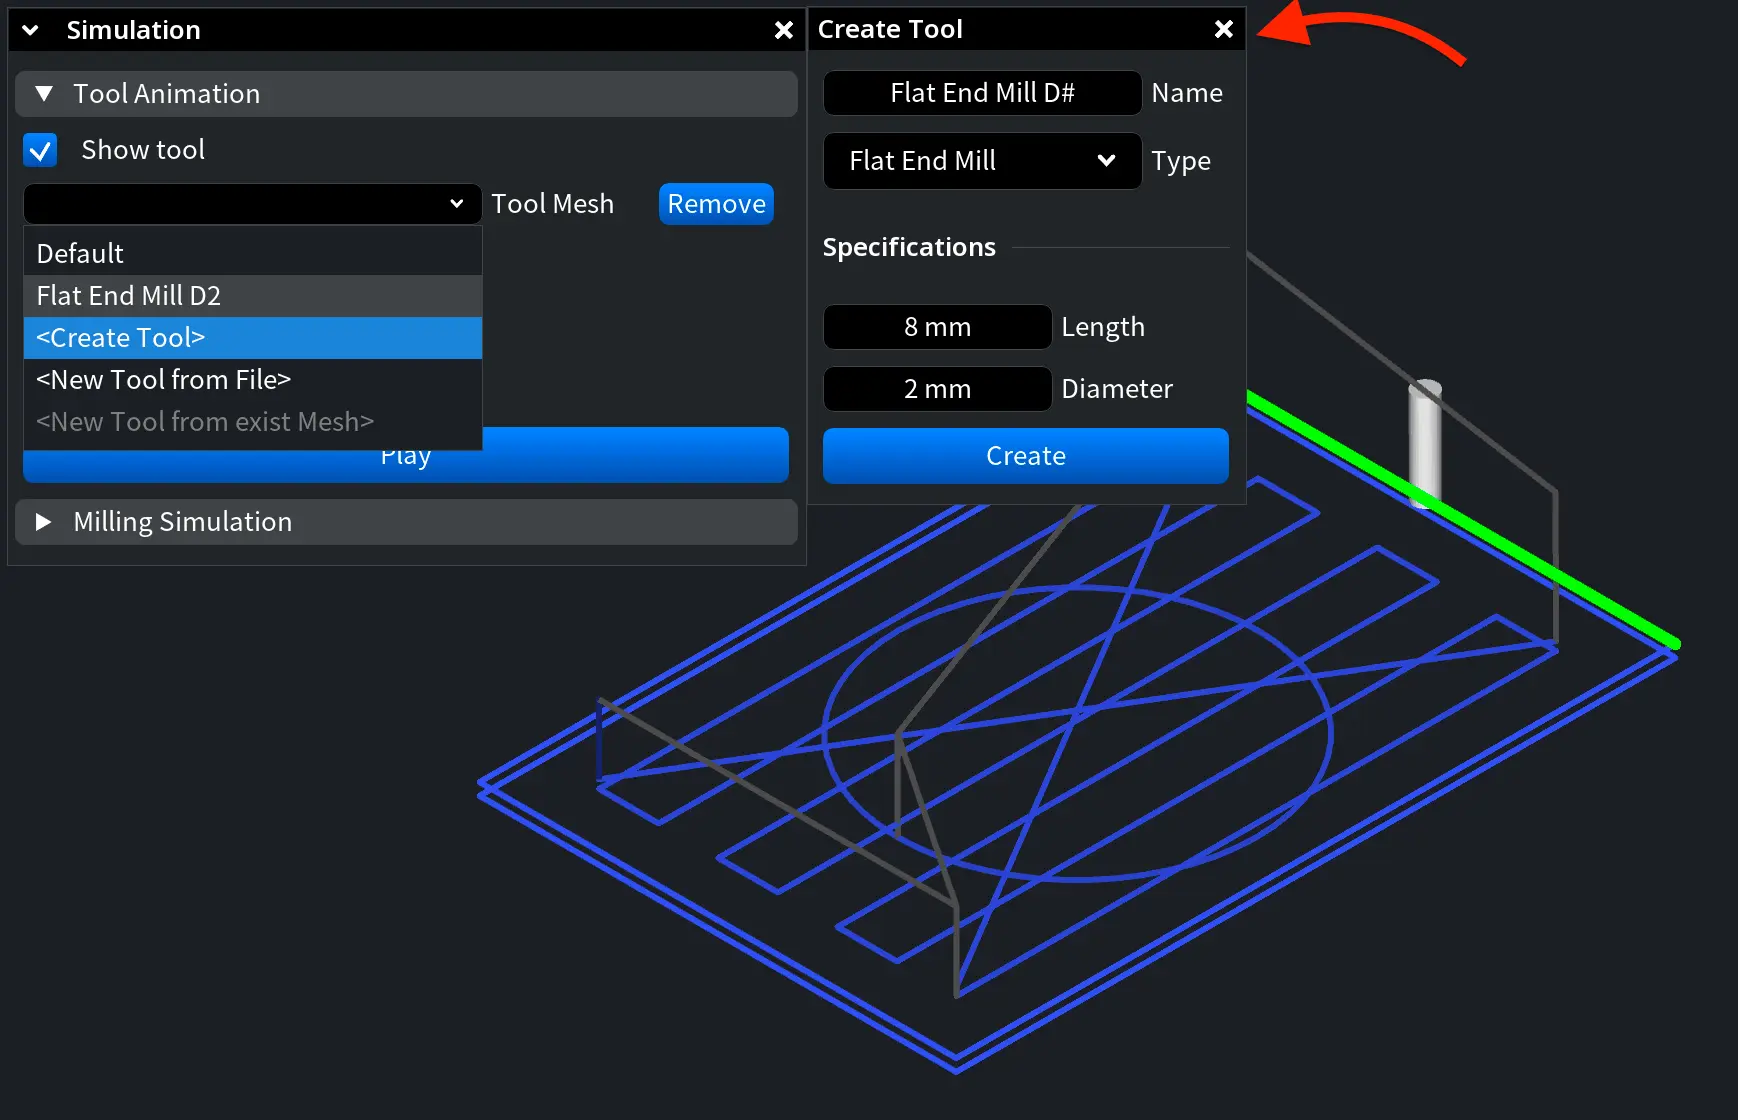
After setting the required values, click Create. The new tool can then be used for the toolpath animation. Once a new tool is created, it appears in the Tool Mesh dropdown and can be selected for the tool animation.
Milling Simulation
The Milling Simulation section allows you to preview how the selected CNC toolpath interacts with a workpiece. It can be used to simulate material removal and check the expected milling result directly in the viewport.
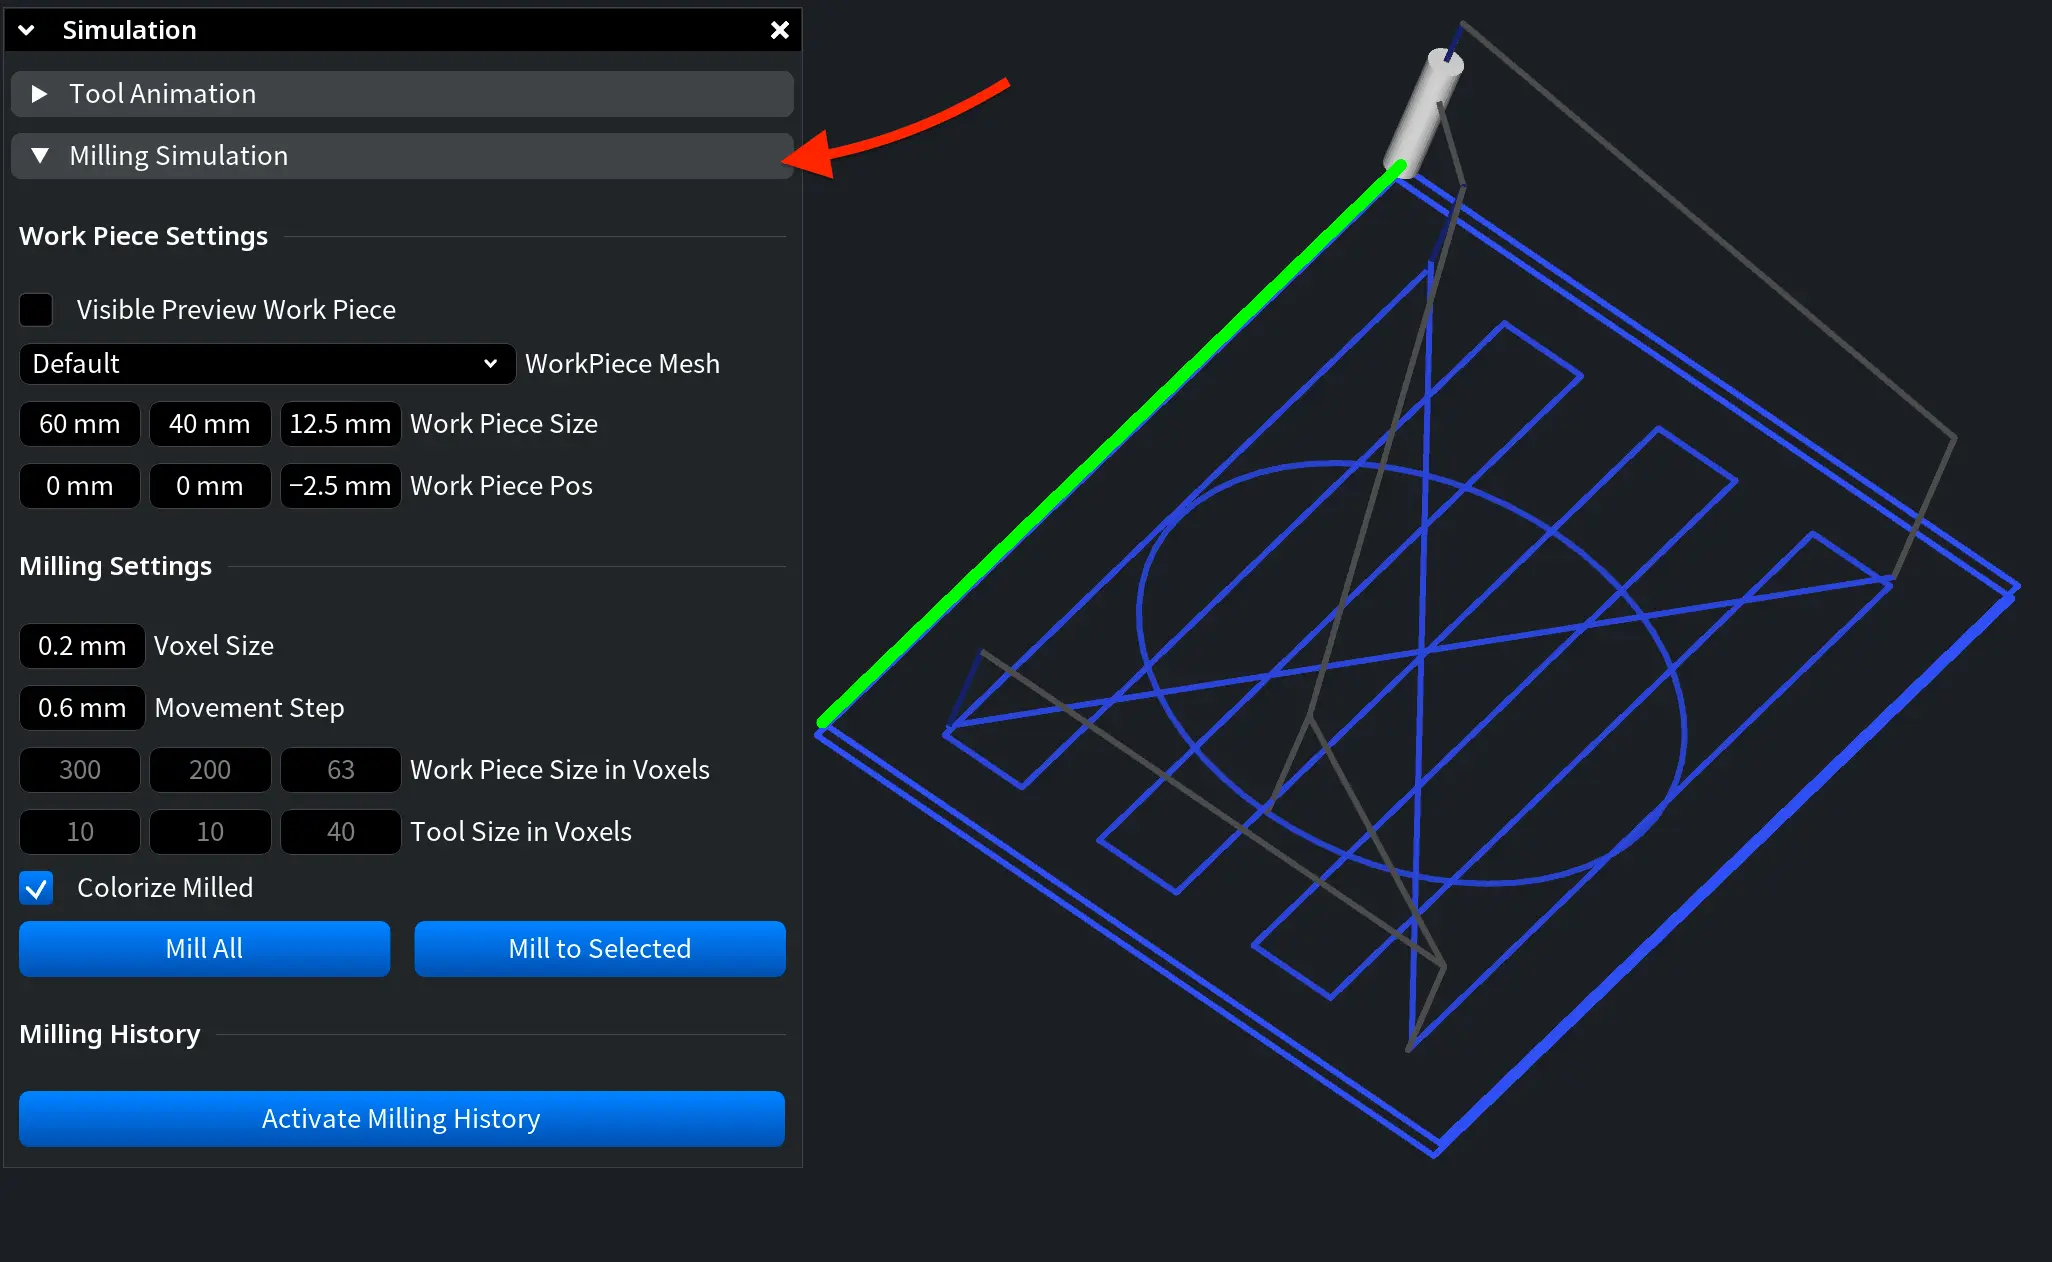
Work Piece Settings define the preview workpiece used for the simulation:
- Visible Preview Work Piece shows or hides the preview workpiece in the viewport.
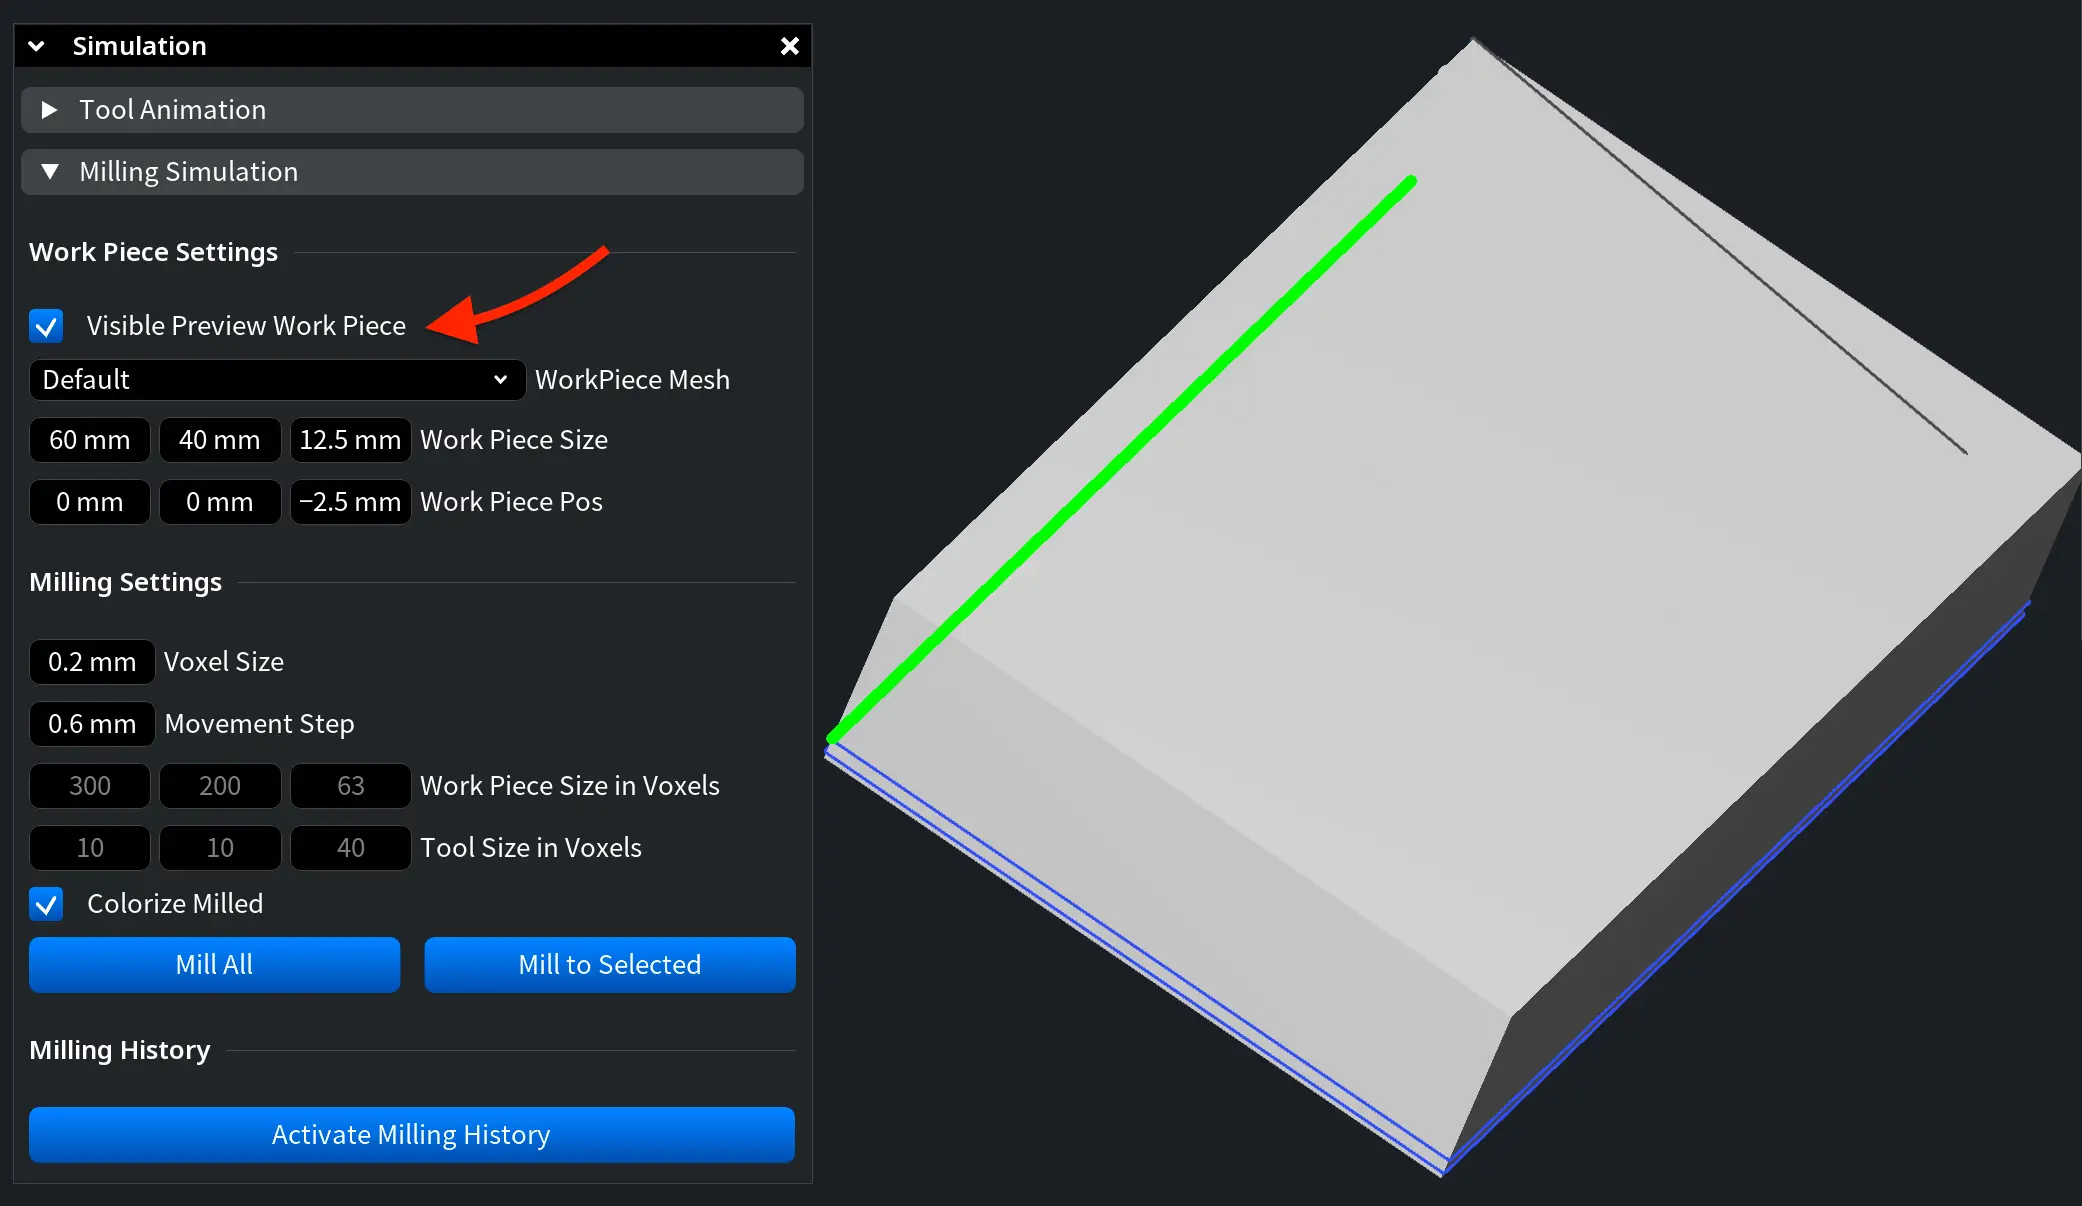
- WorkPiece Mesh allows you to select the workpiece mesh. You can use the default workpiece or select another available one.
- Work Piece Size defines the size of the workpiece along the X, Y, and Z axes.
- Work Piece Pos defines the position of the workpiece in the scene.
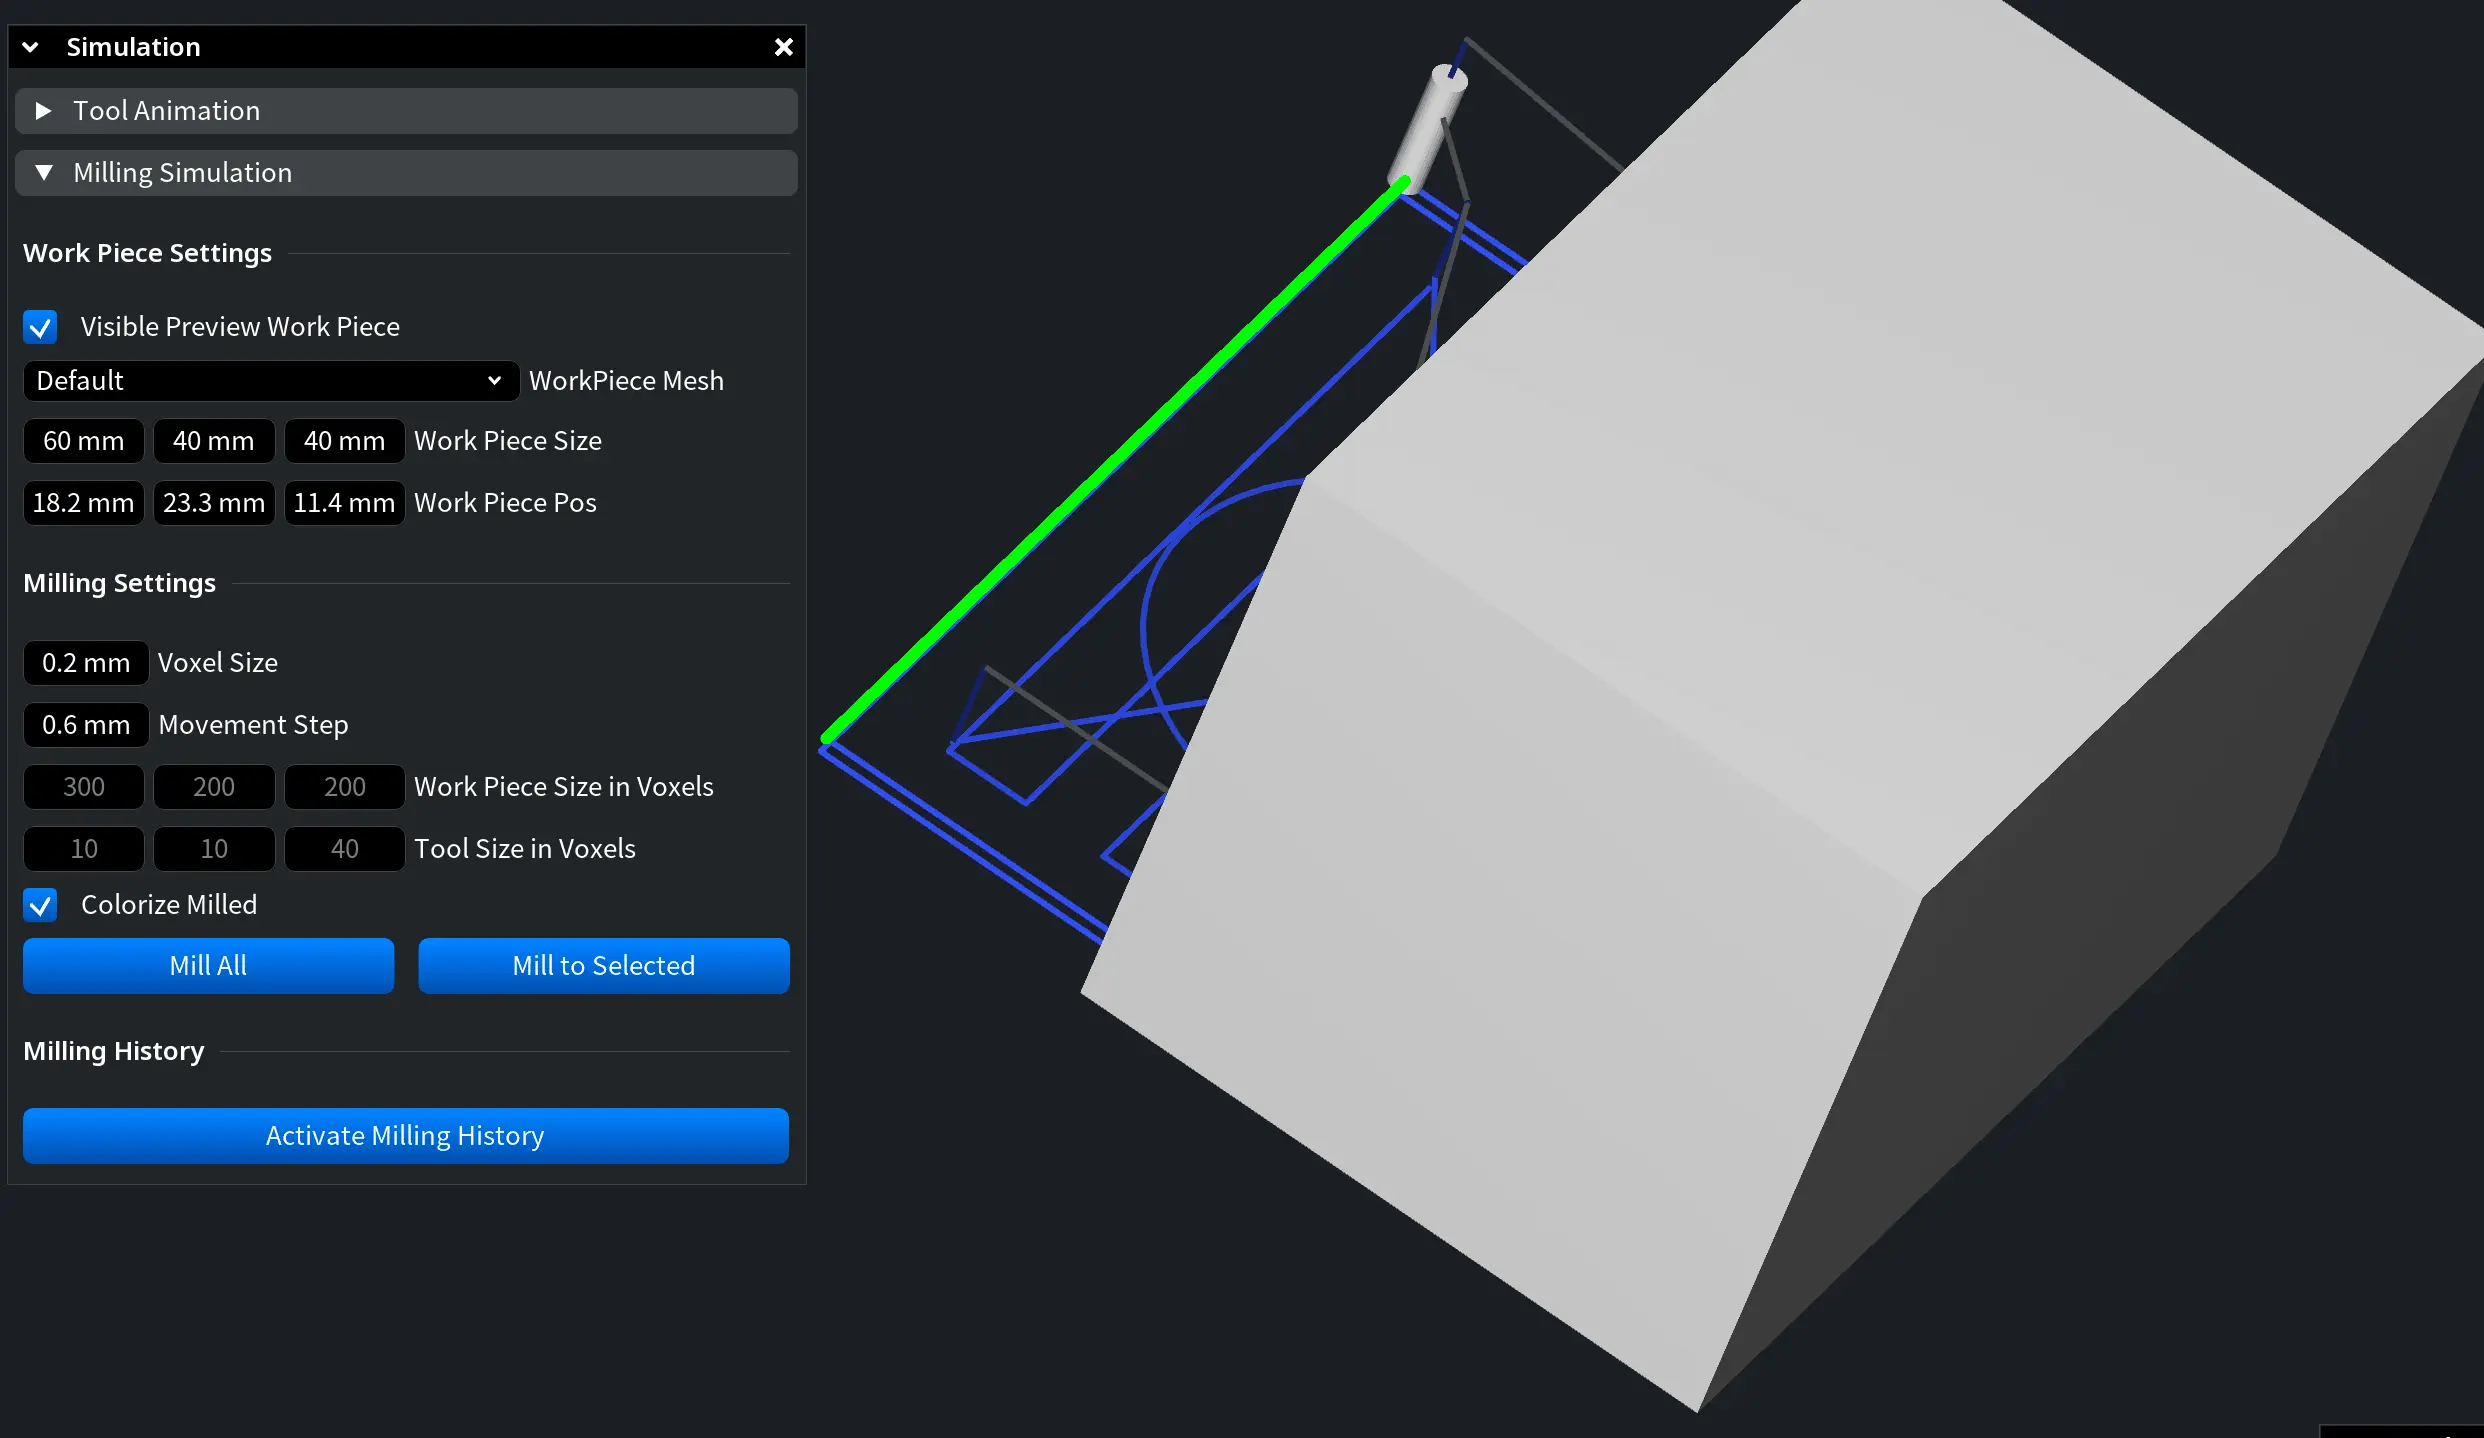
Milling Settings control the simulation precision and how the tool movement is processed:
- Voxel Size defines the voxel resolution used for the milling simulation. A smaller value gives a more detailed result but may require more processing time.
- Movement Step defines the step used to process tool movement during simulation.
- Work Piece Size in Voxels shows the workpiece resolution in voxels based on the selected workpiece size and voxel settings.
- Tool Size in Voxels shows the tool size converted into voxels for the simulation.
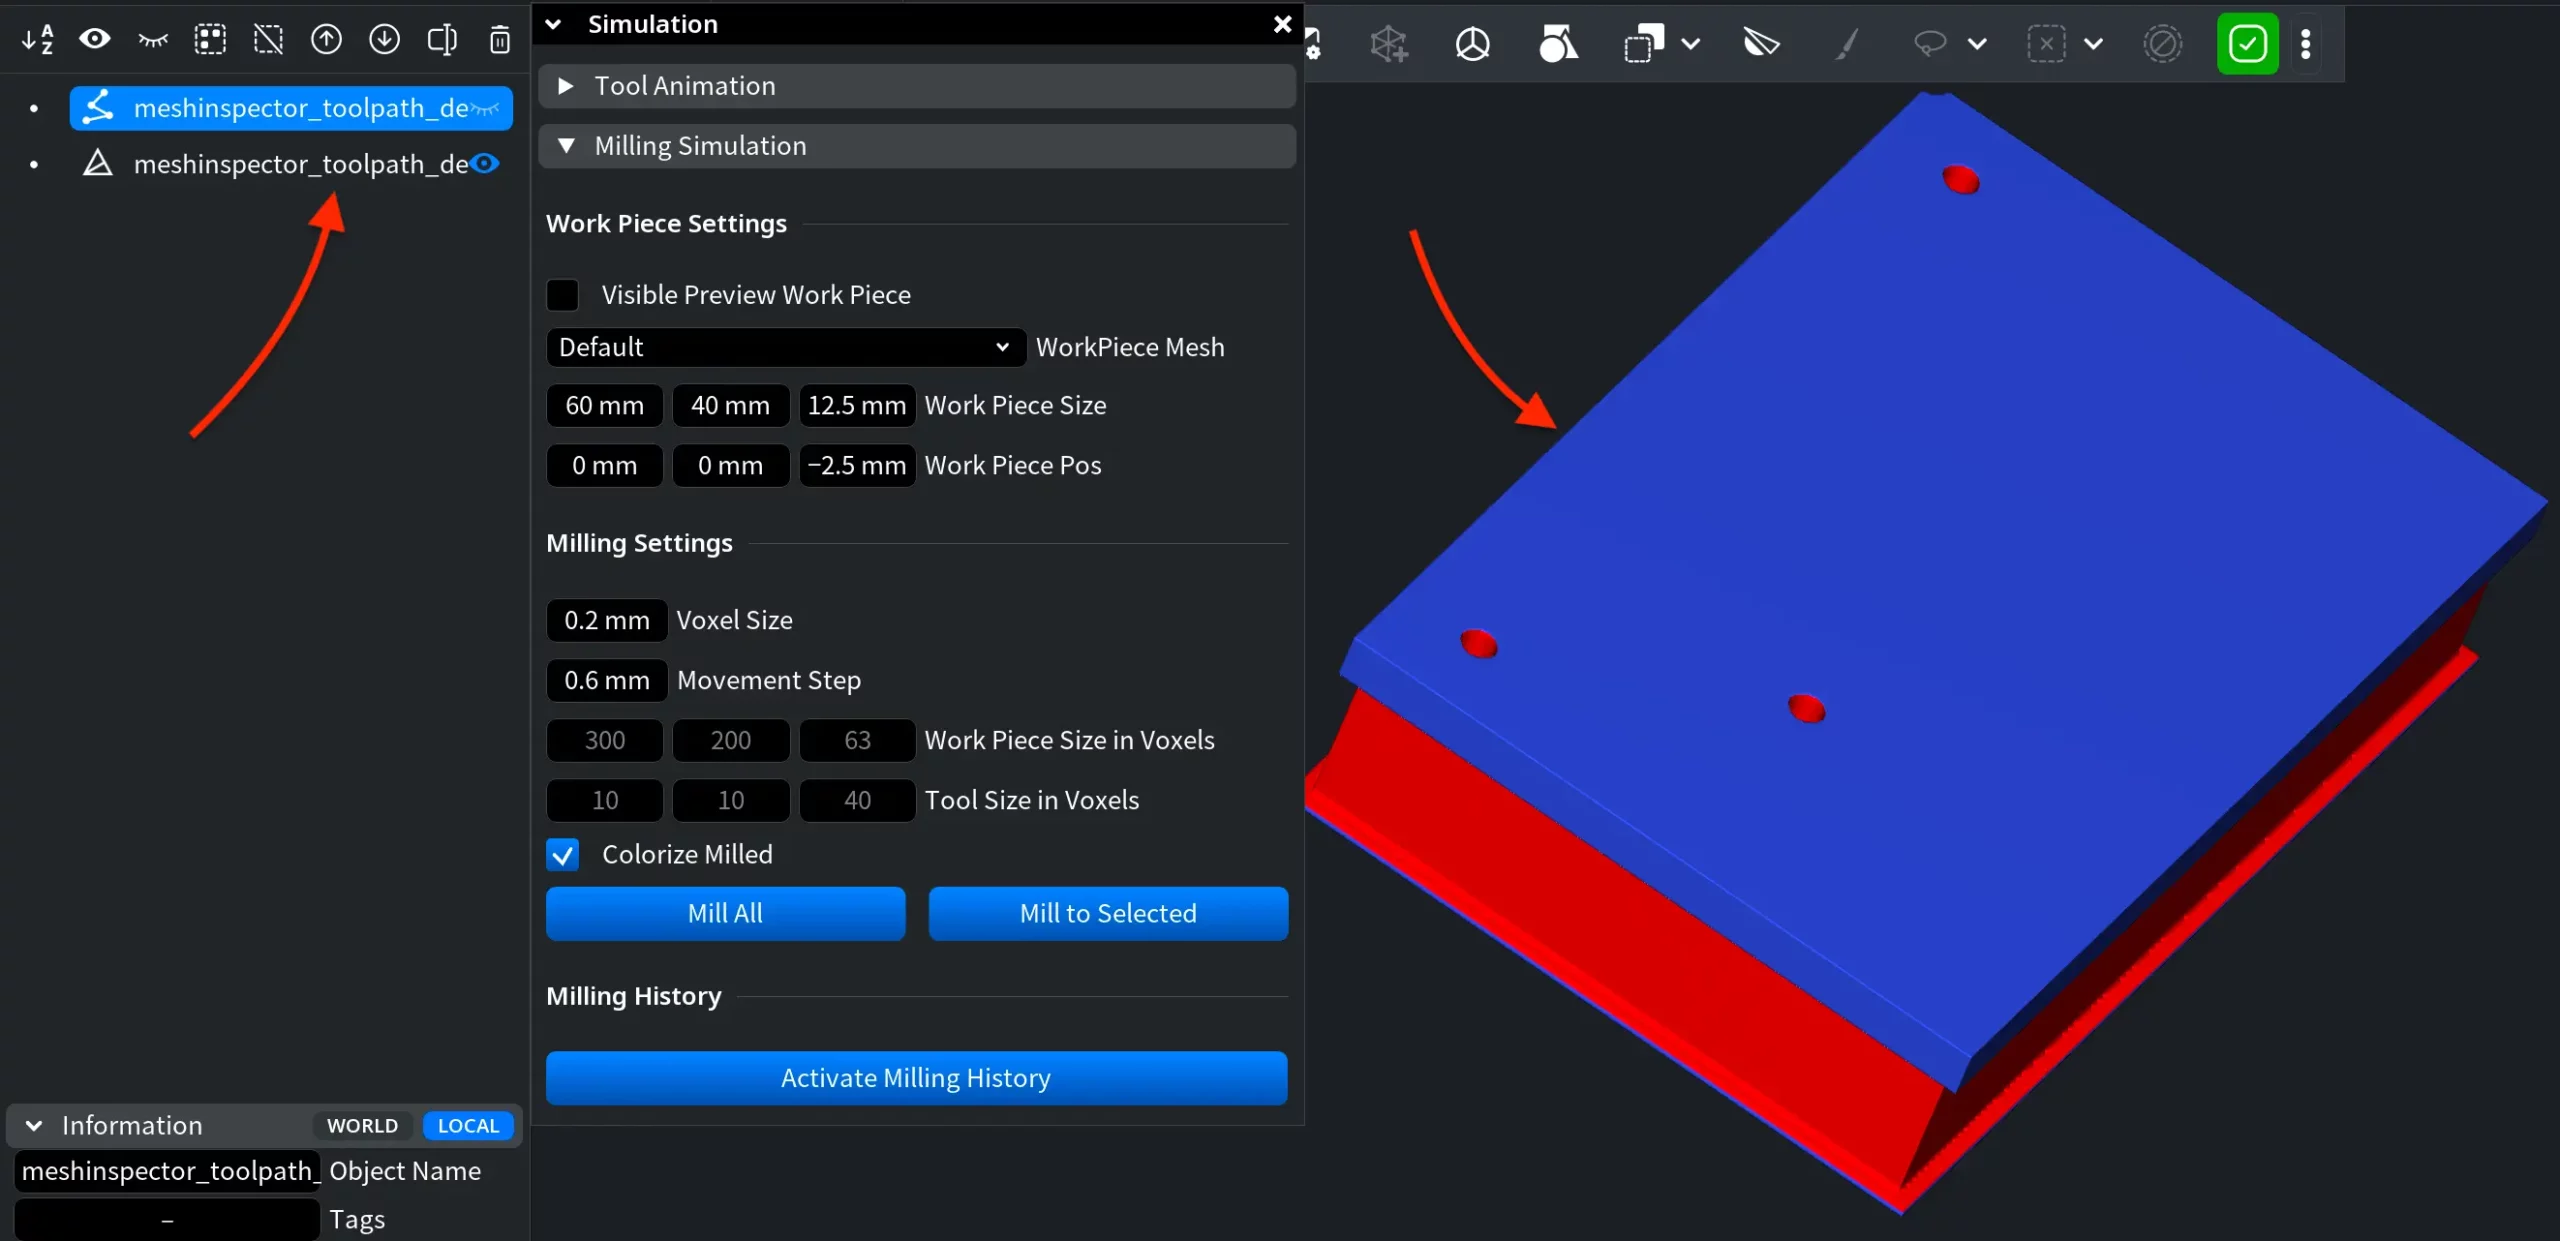
- Colorize Milled colorizes the milling result.
Use the milling buttons to run the simulation.
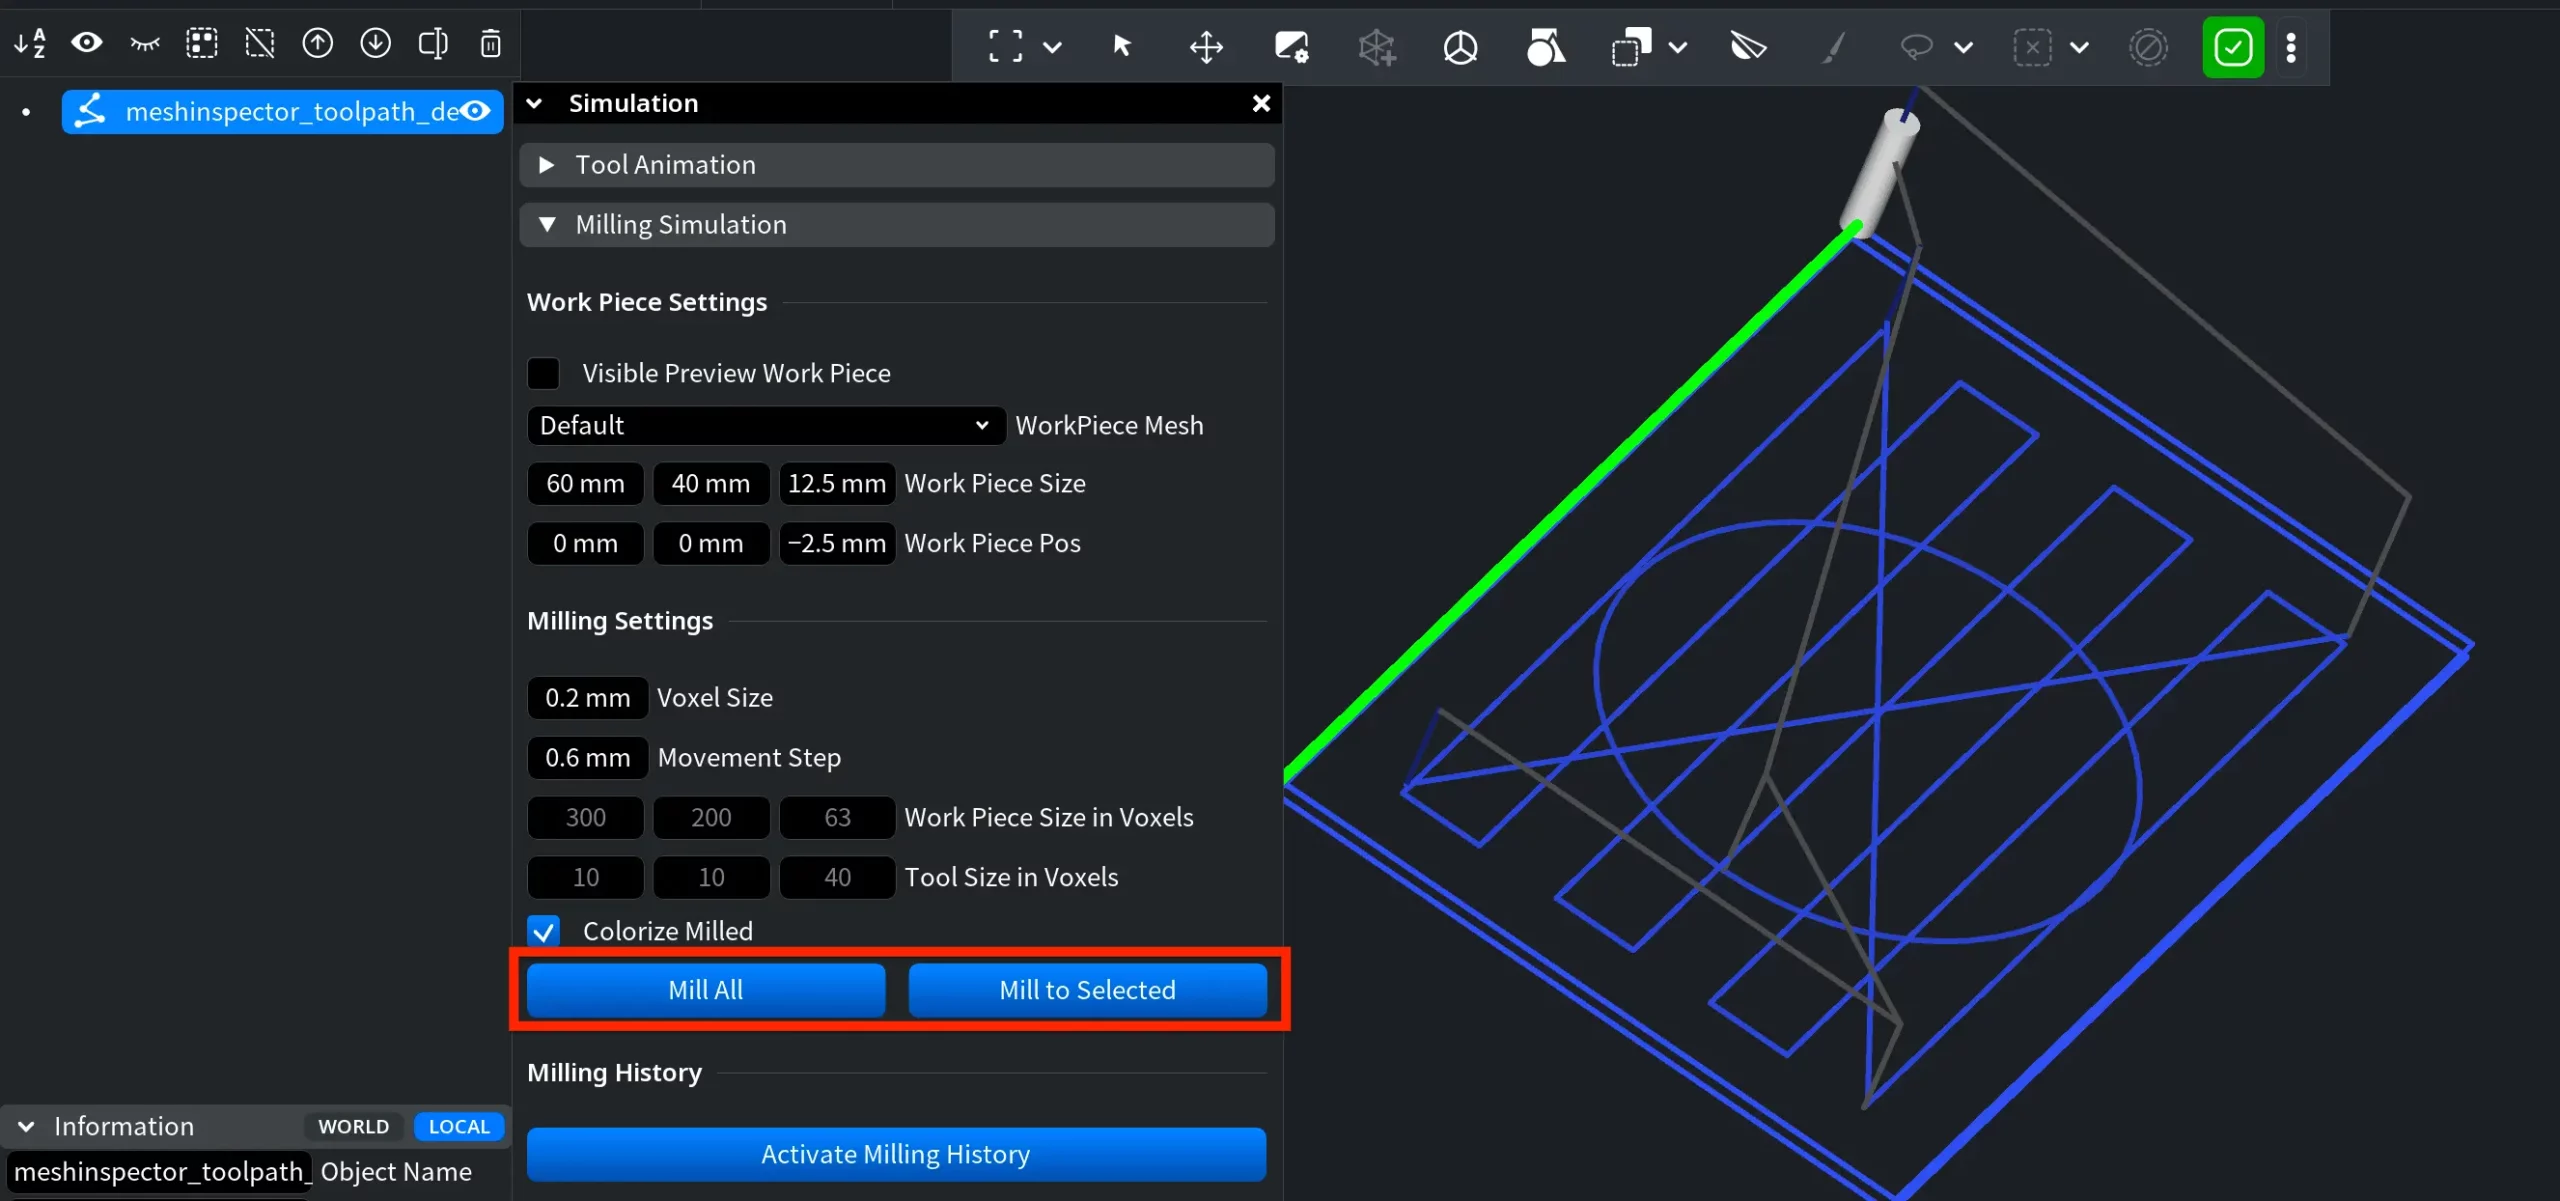
- Mill All runs the milling simulation for the entire toolpath.
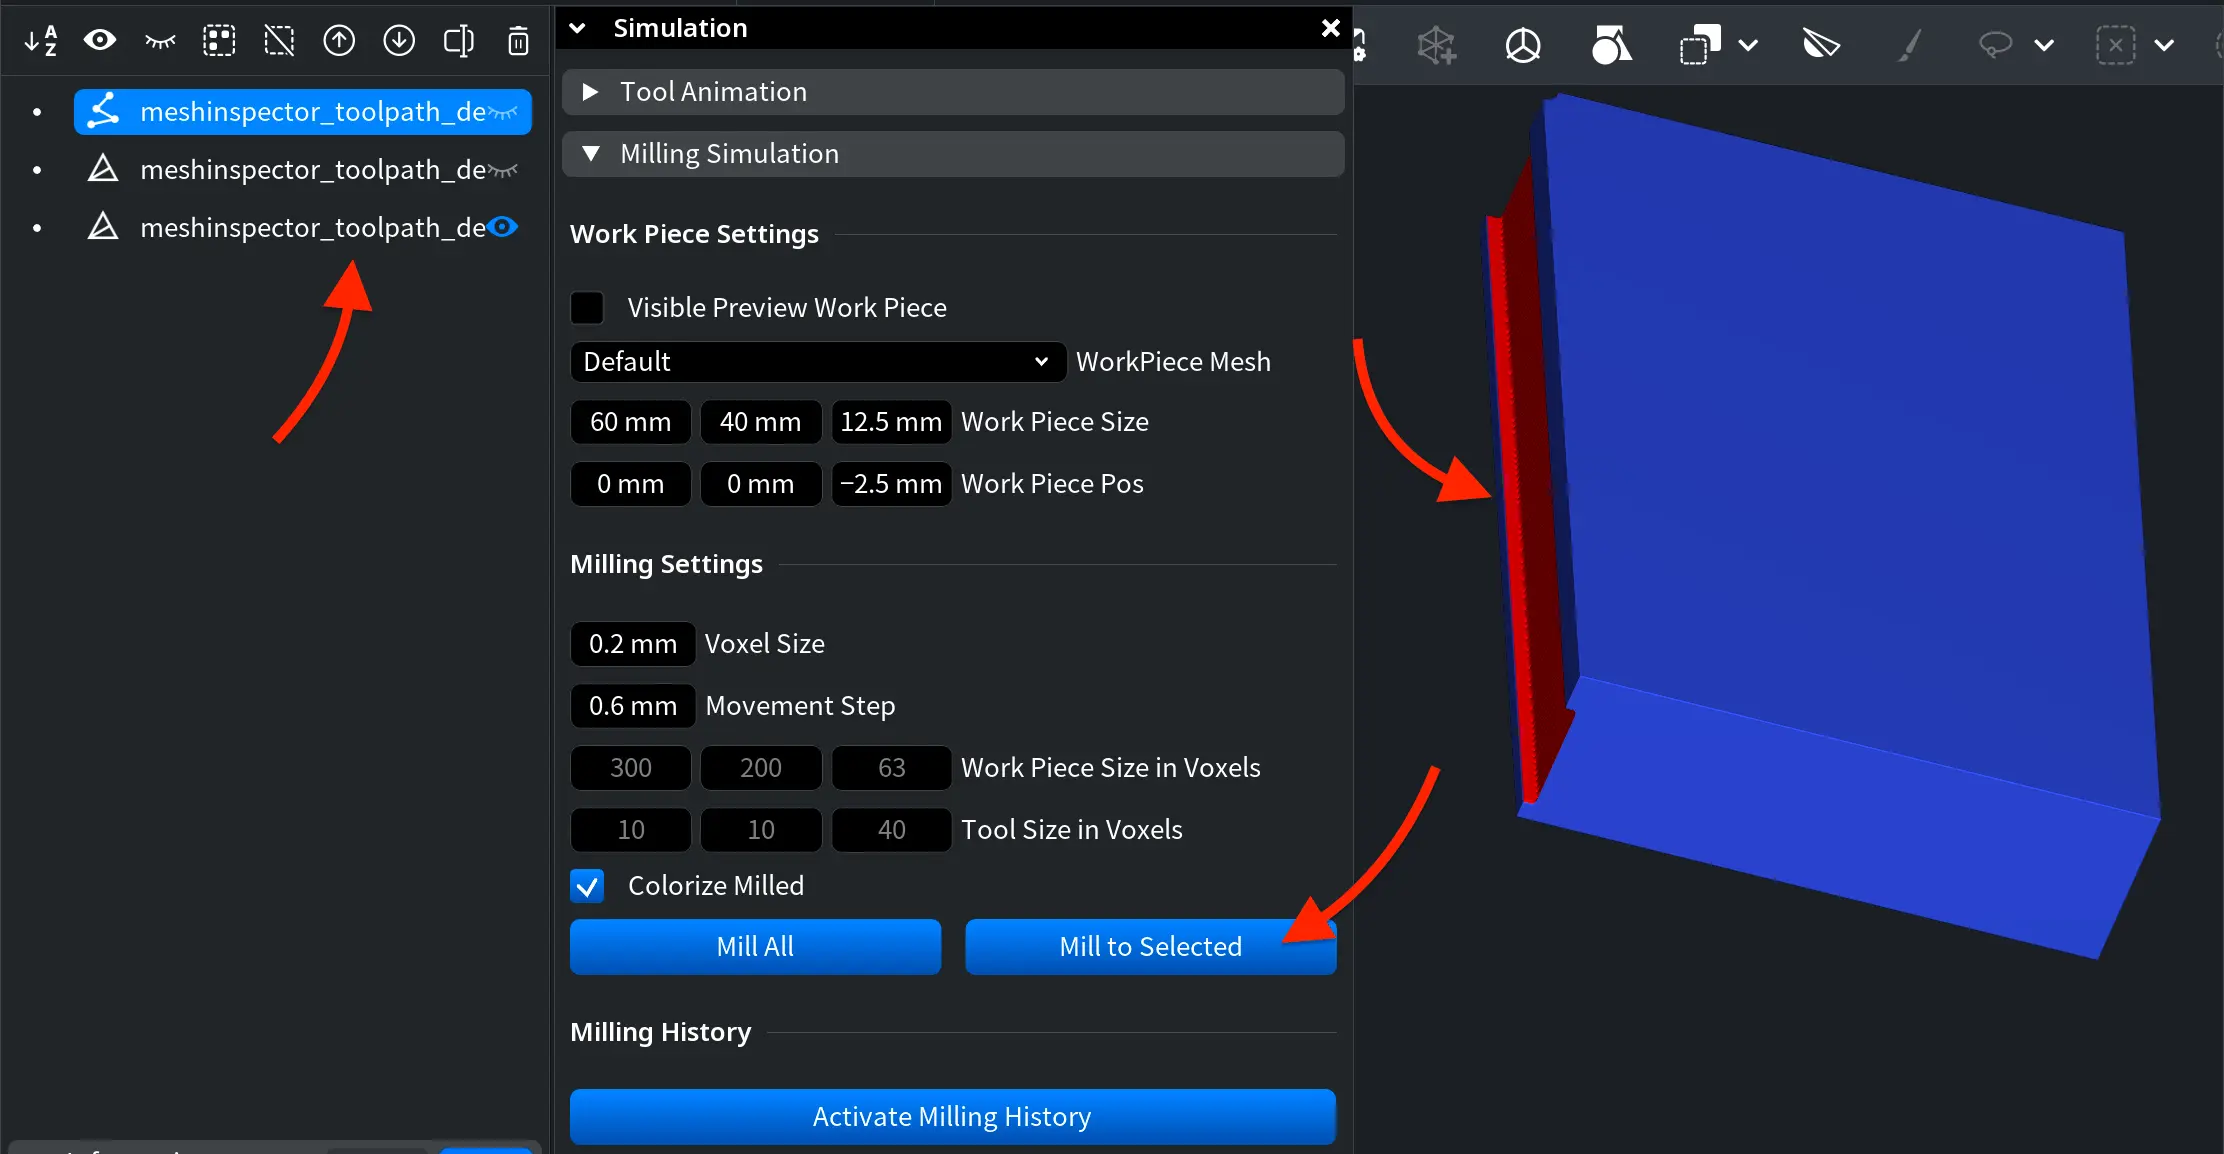
- Mill to Selected runs the simulation up to the selected toolpath movement.
Milling History
The Milling History section allows you to calculate and display the milling progress.
Click Activate Milling History to calculate the milling history for the toolpath. After you click it, the following options become available.
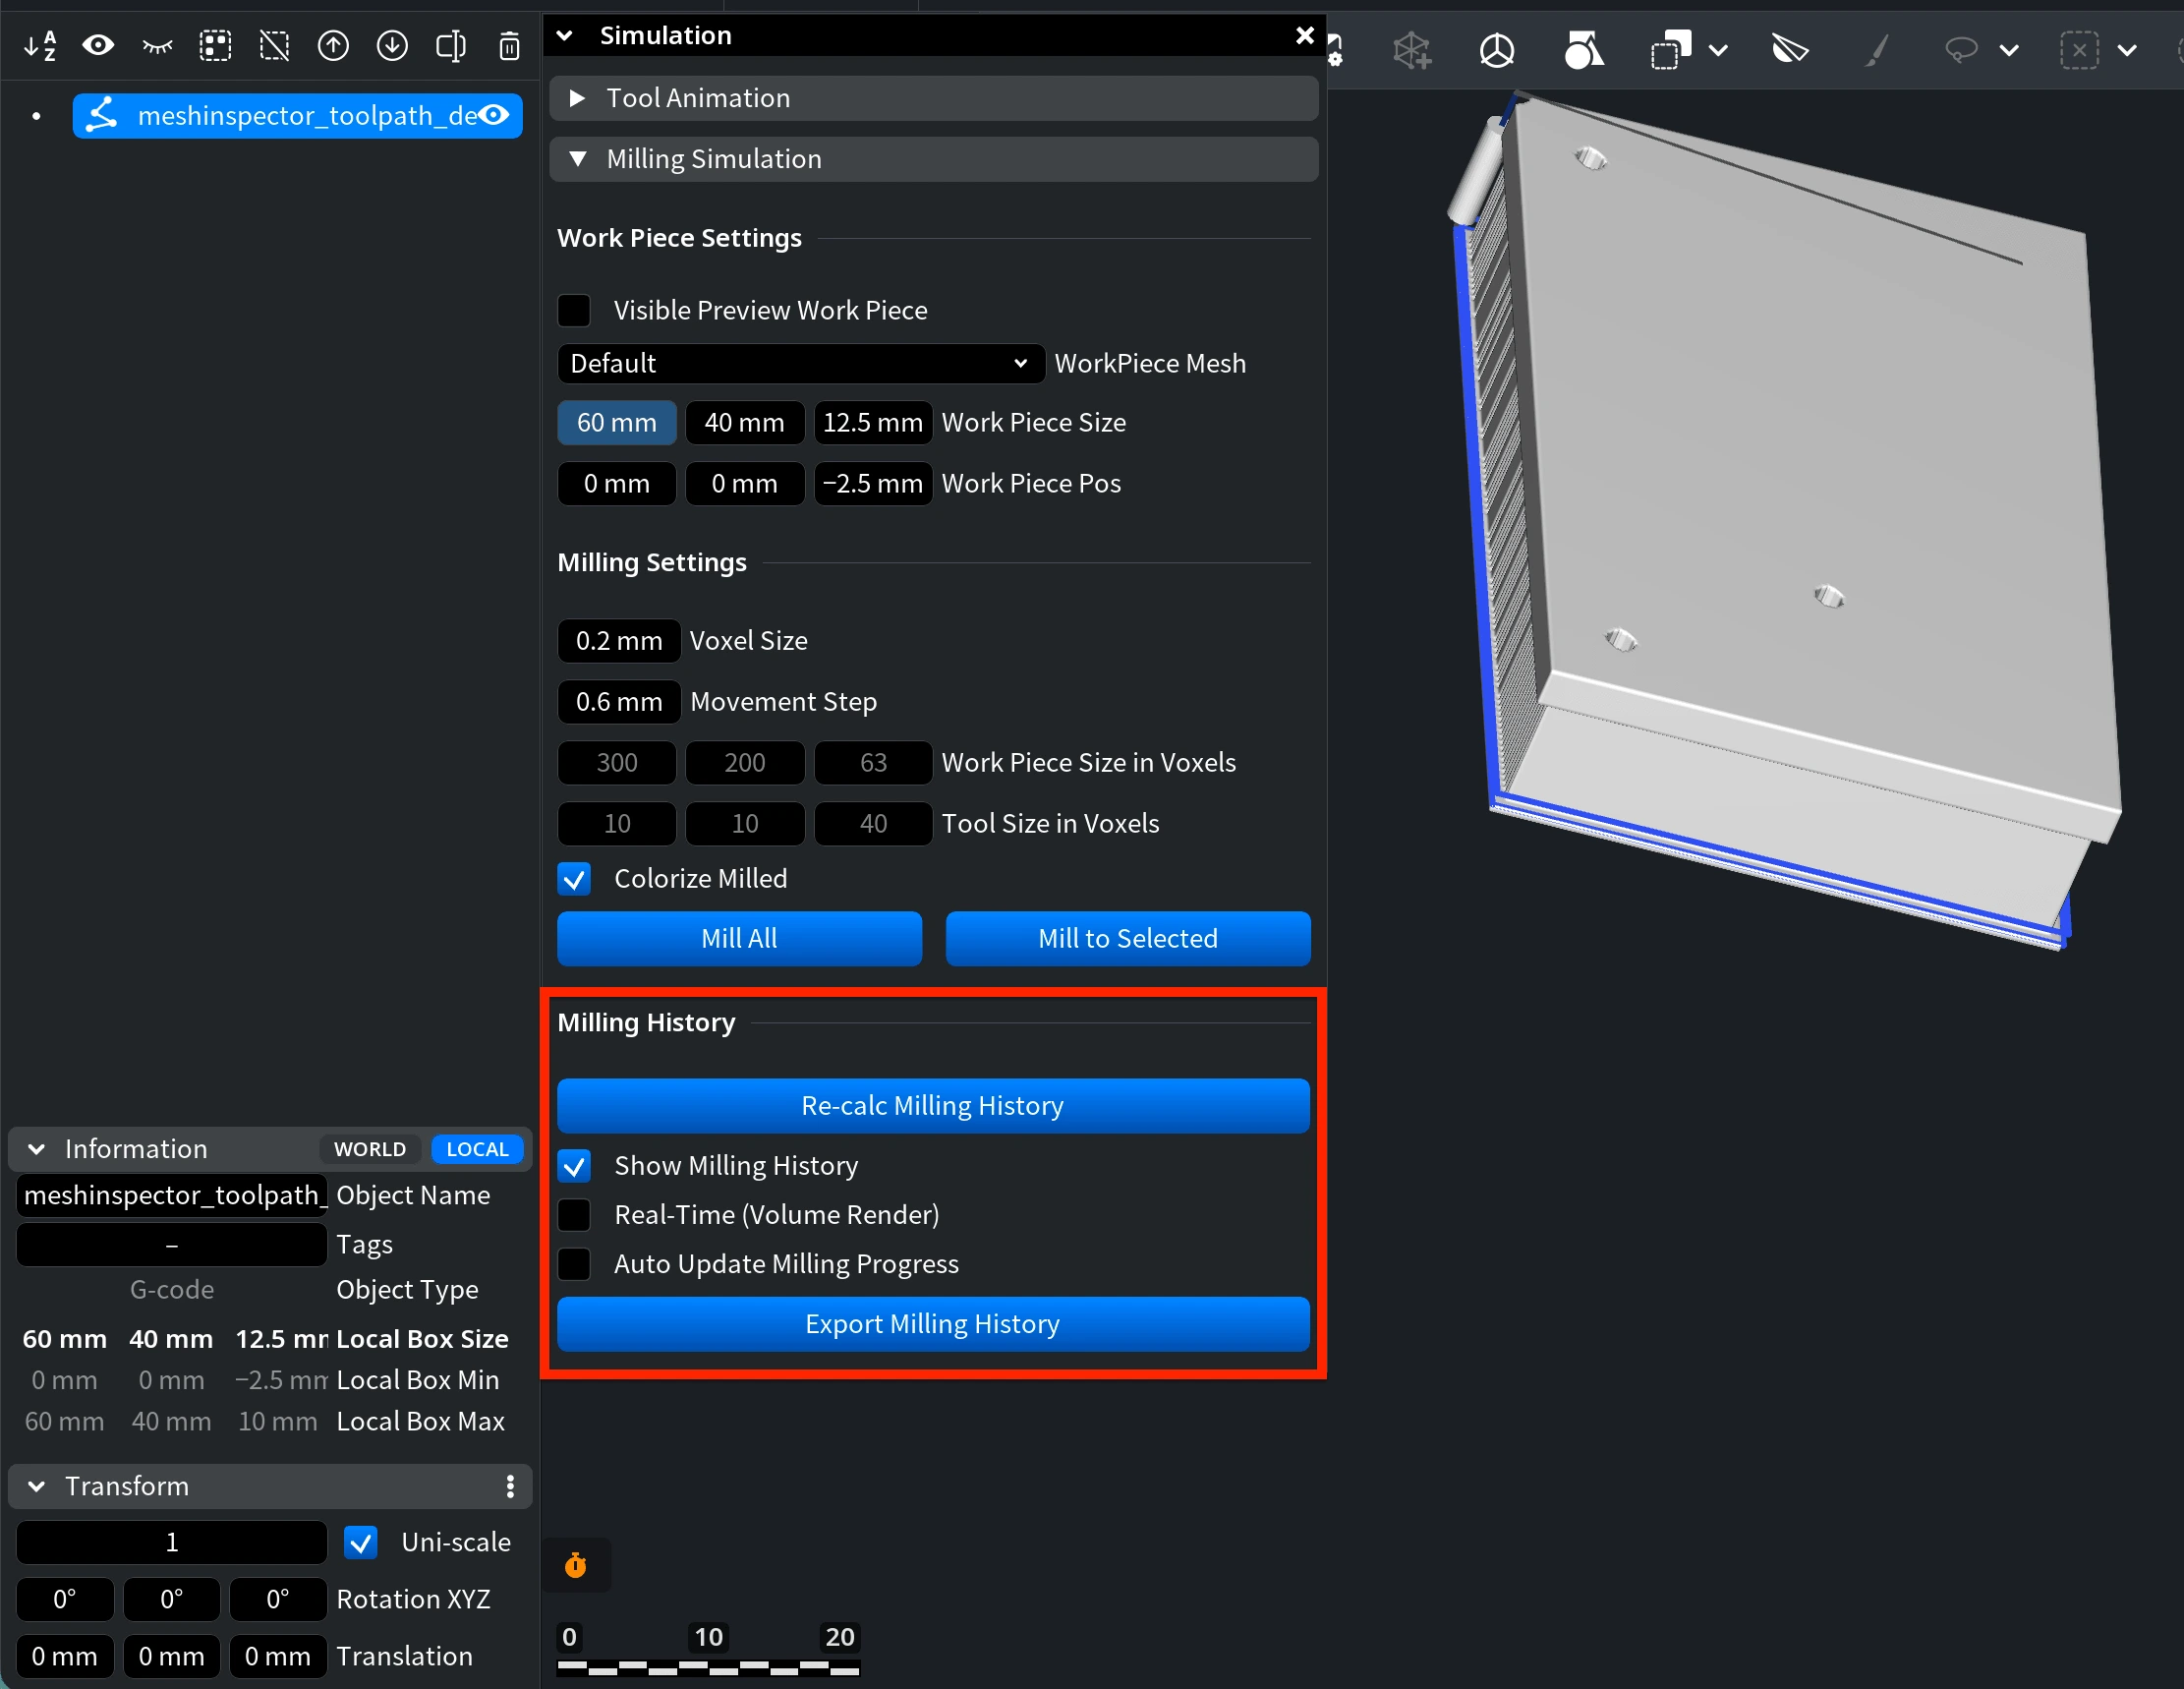
- Re-calc Milling History recalculates the milling history after changes are made.
- Show Milling History displays the calculated milling history in the viewport.
- Real-Time (Volume Render) enables real-time volume rendering for the milling history preview.
- Auto Update Milling Progress, available only when Real-Time (Volume Render) is not enabled, automatically updates the displayed milling progress.
- Export Milling History exports the calculated milling history as a separate object.
Guide to the G-code Visualizer Tool in MeshInspector