When working with polylines, it is often necessary to analyze how the line changes along its length. MeshInspector provides the Lines Derivative tool for this purpose. It allows you to analyze the derivatives of a polyline and identify critical points along the line.
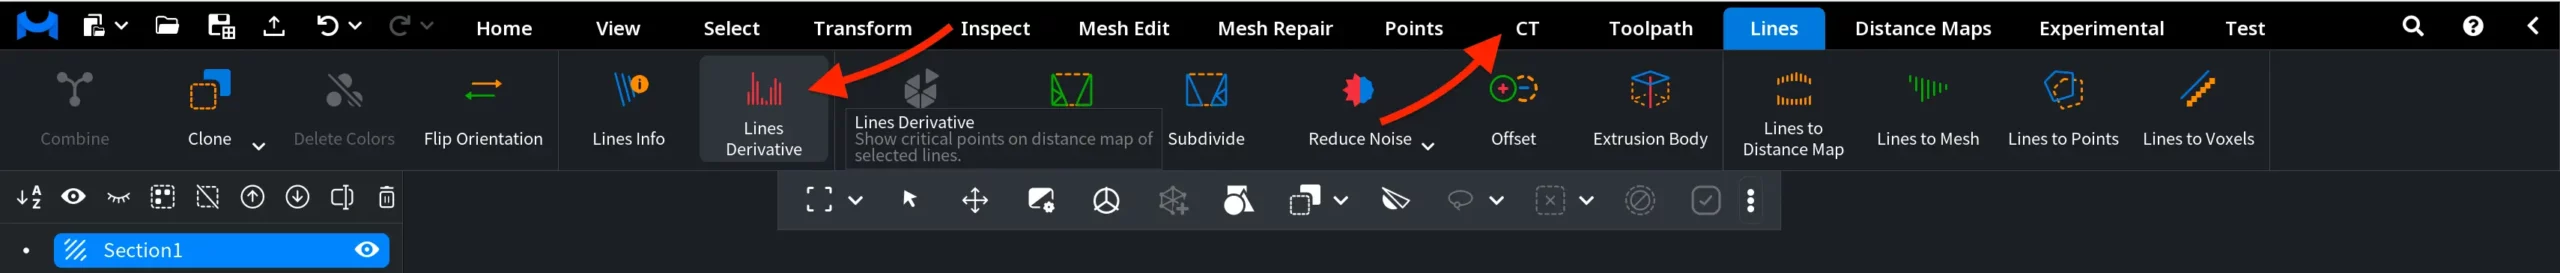
To access this tool, open the Lines tab in the top toolbar and click Lines Derivative, as shown in the screenshot below. The tool calculates derivative values along the selected polyline and displays the detected critical points in the viewport, helping you identify areas where the line’s behavior changes.
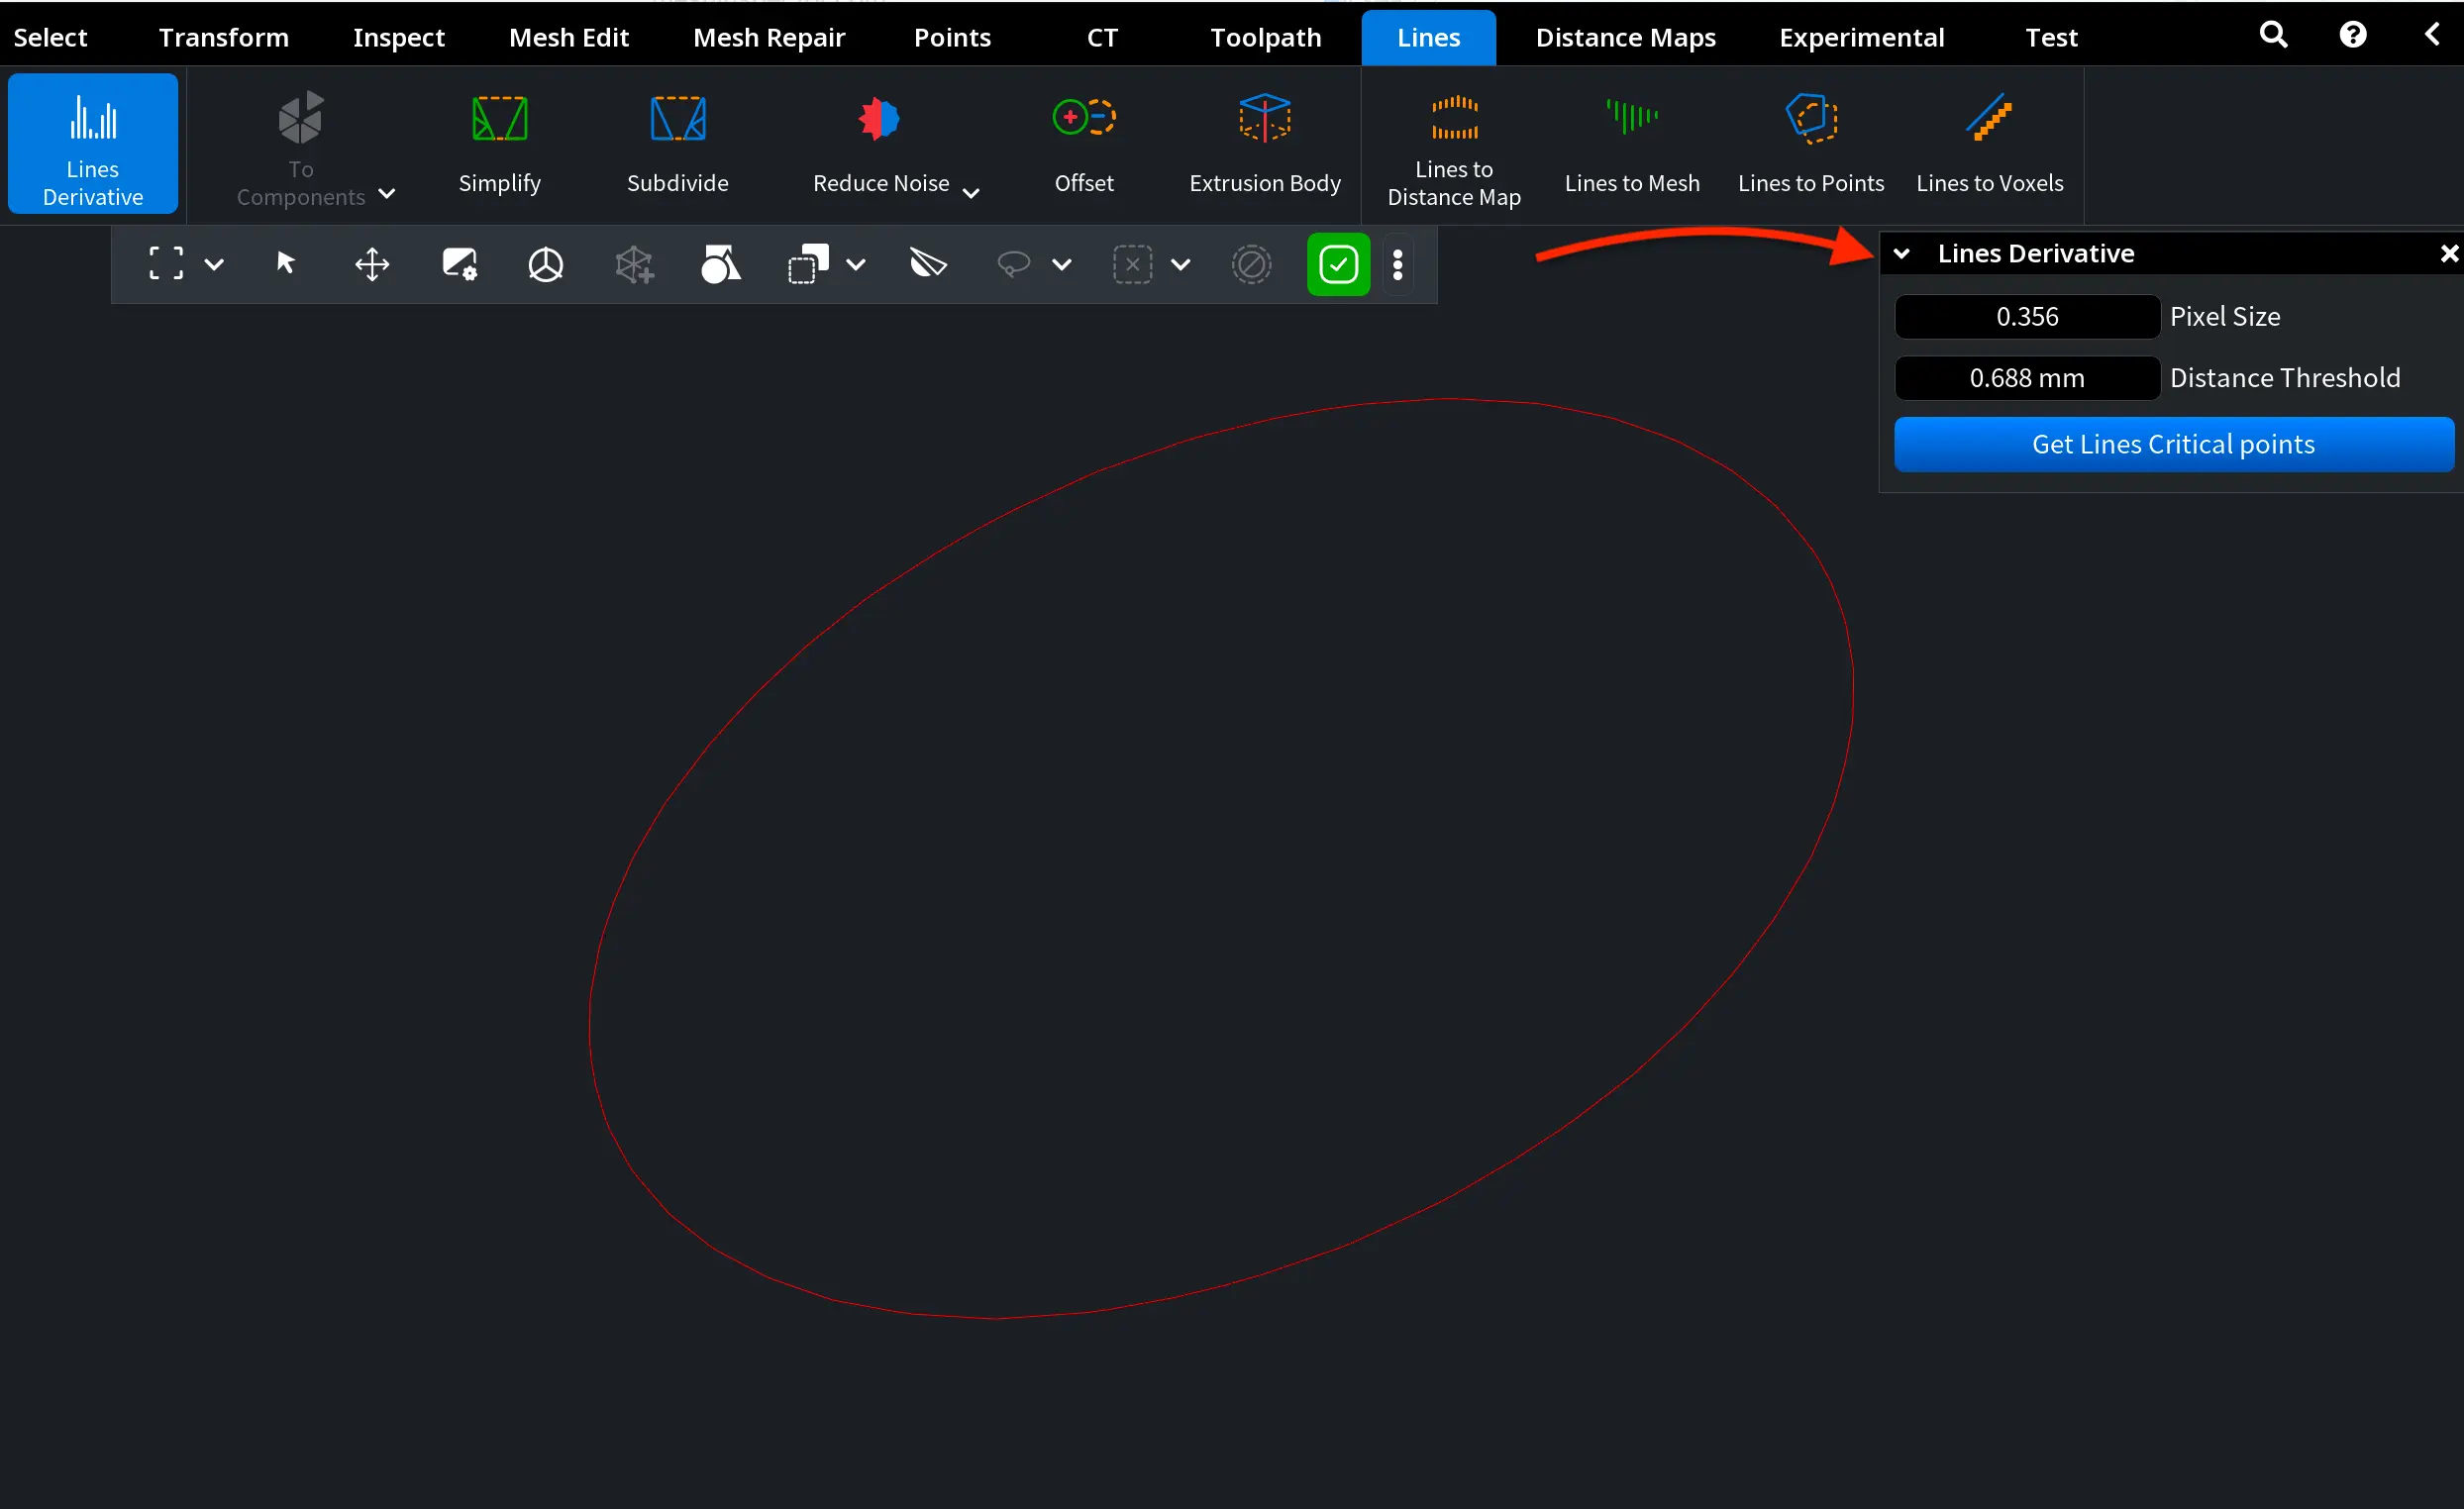
Once you click Lines Derivative, a dedicated Lines Derivative panel appears on the right side of the viewport. This panel contains the parameters used to compute derivatives along the selected polyline and detect its critical points. By adjusting these settings, you can control how the derivative values are calculated and how sensitive the tool is when identifying changes in the line.
The panel includes:
- Pixel Size. Controls the resolution used when sampling the polyline for derivative analysis. Smaller values increase the sampling resolution, which allows the tool to detect finer geometric variations along the line. Larger values reduce the sampling resolution, producing fewer detected points and a more generalized analysis of the line’s behavior.
- Distance Threshold defines the minimum spatial distance between detected critical points. Lower values allow points to appear closer to one another, which may produce denser clusters of critical points. Higher values filter out nearby points, keeping only those that are sufficiently separated along the line.
After configuring these parameters, click Get Lines Critical points to analyze the selected polyline and display its critical points on the distance map.
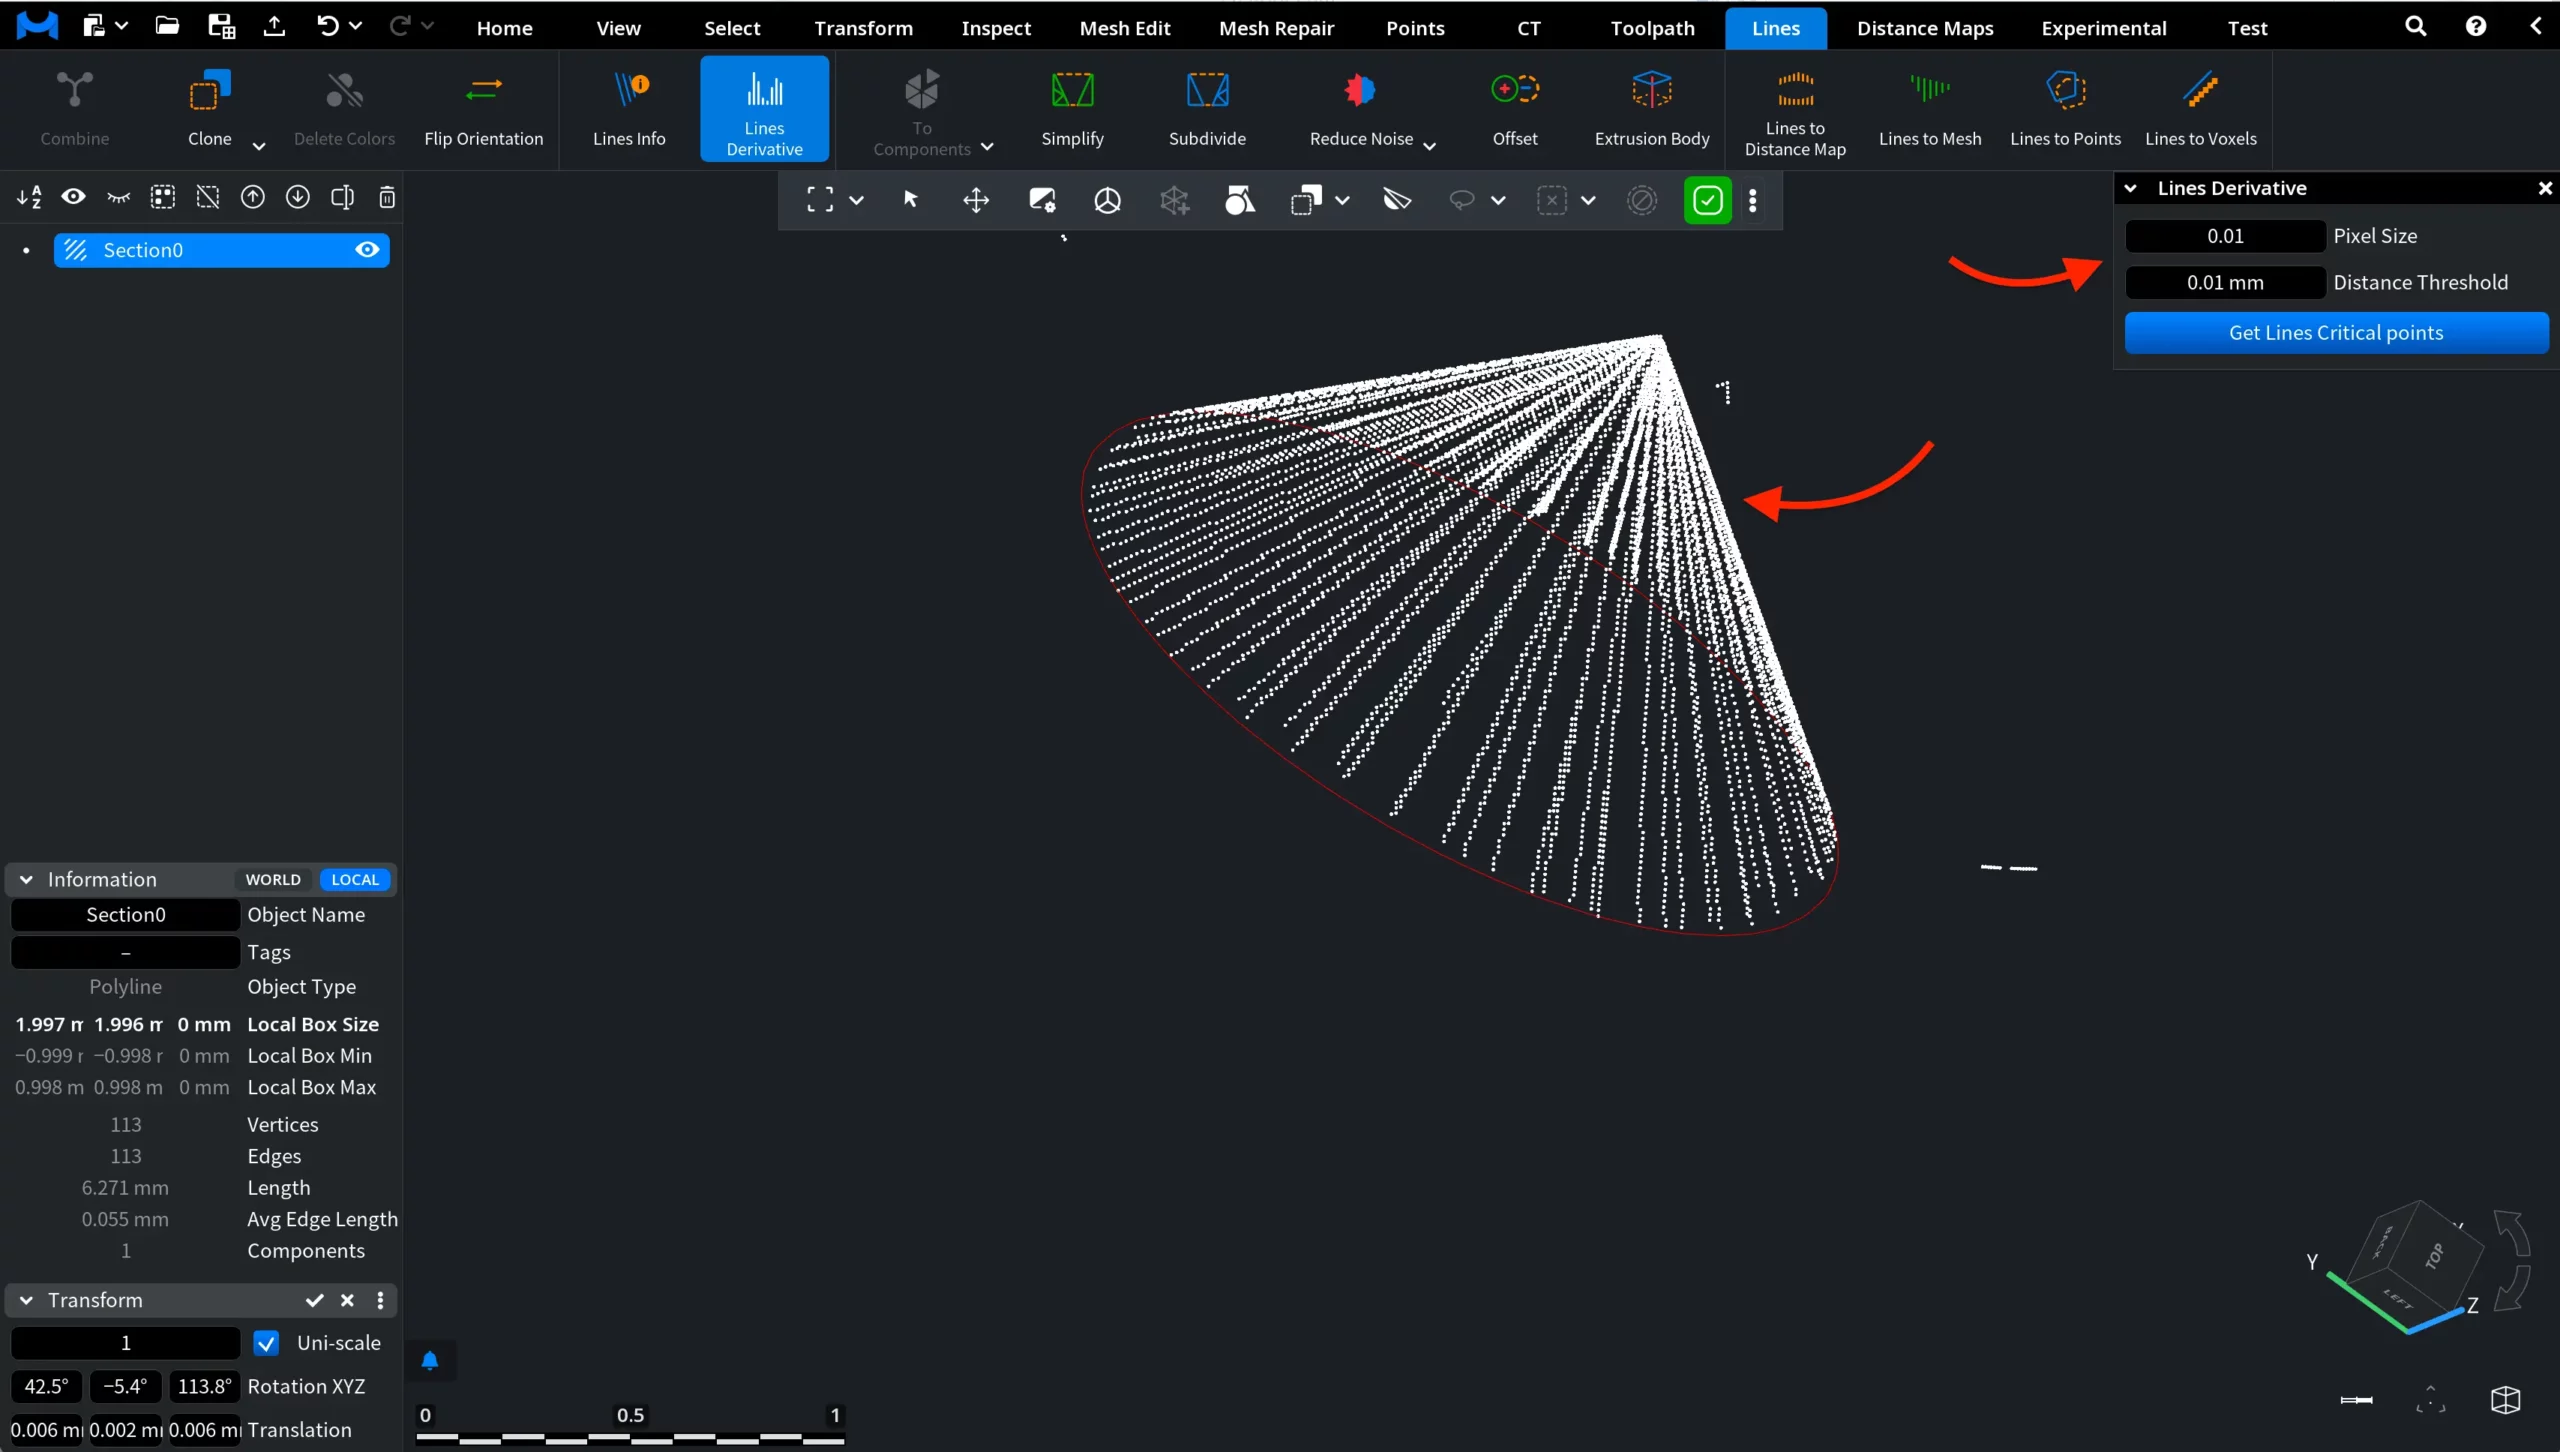
Lines Derivative: Example # 1. Default Settings
In this example, the Lines Derivative tool is applied to a closed polyline using the default parameter values. After clicking Get Lines Critical points, MeshInspector analyzes the derivatives along the selected polyline and displays the detected critical points in the viewport.
The white markers represent the locations where the derivative analysis identifies significant geometric changes along the line. These points highlight areas where the behavior of the polyline varies, helping you visually inspect how the shape evolves along its trajectory.
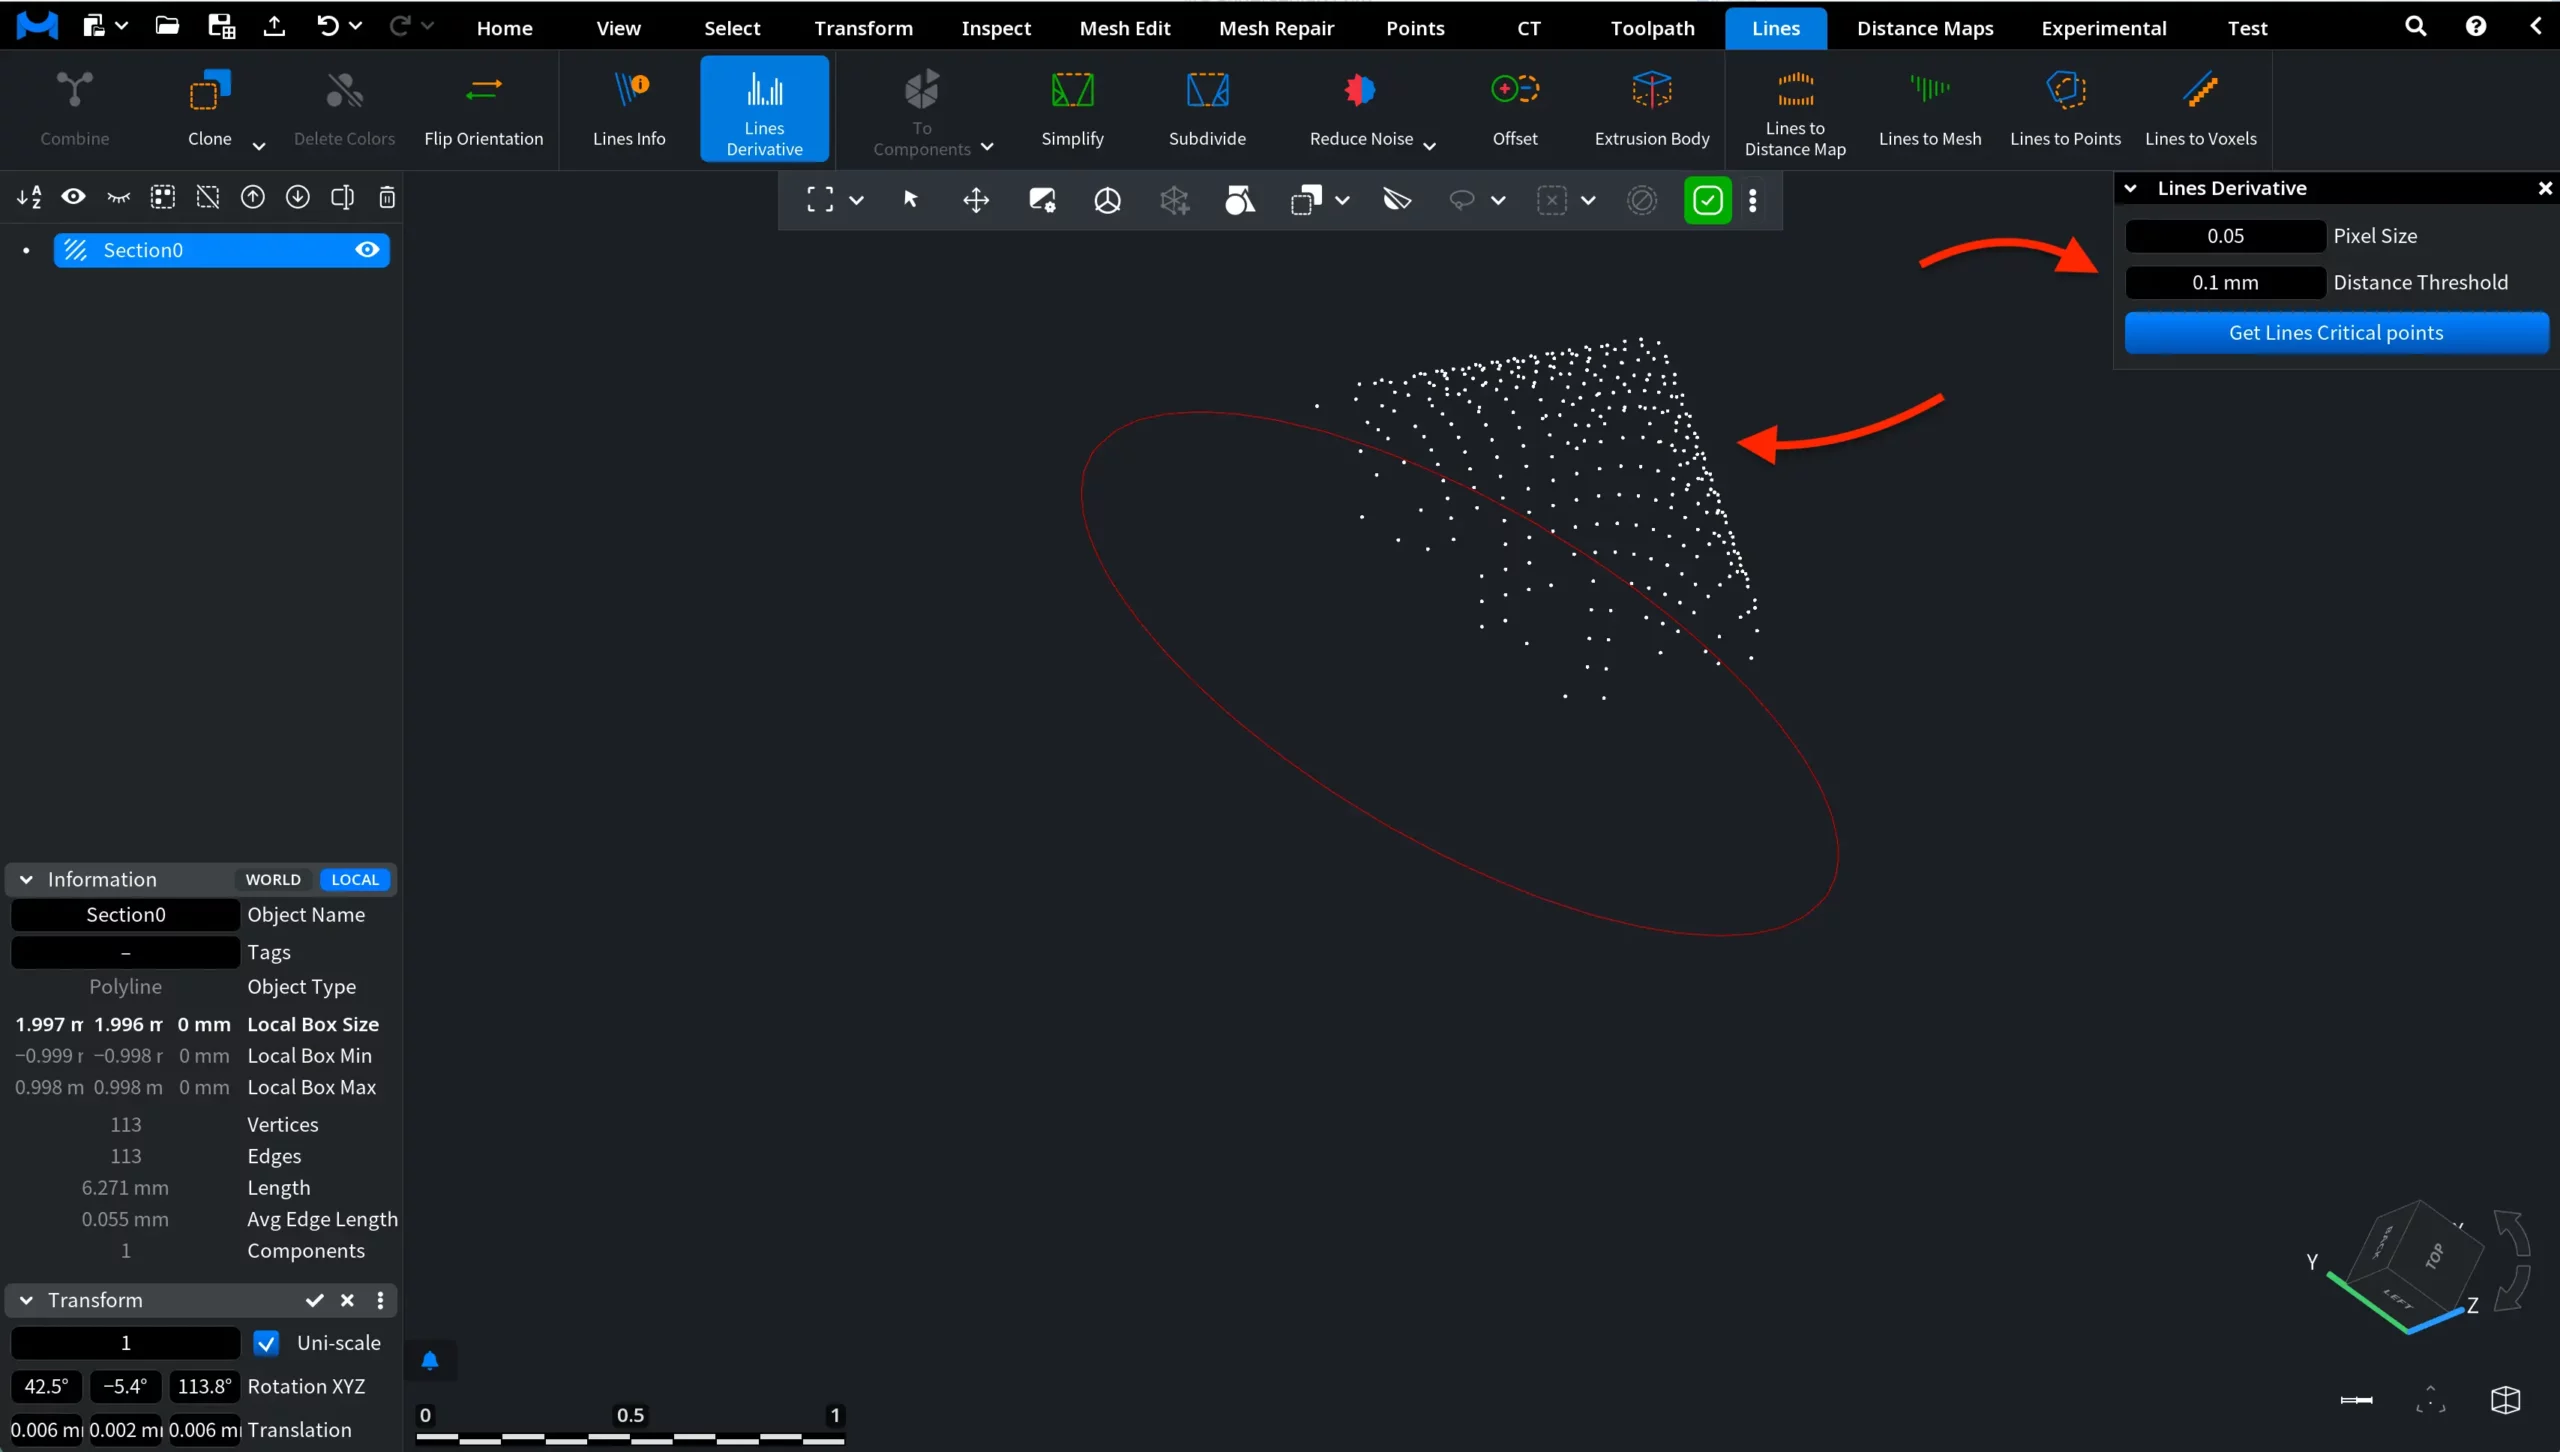
Lines Derivative: Example # 2. Lower Settings
In this example, the Pixel Size and Distance Threshold parameters are reduced compared to the default configuration. After clicking Get Lines Critical points, the tool performs a more sensitive derivative analysis along the polyline. As a result, a significantly larger number of critical points is detected and displayed in the viewport. The white markers appear much more densely along the line, highlighting even small geometric variations in the polyline.
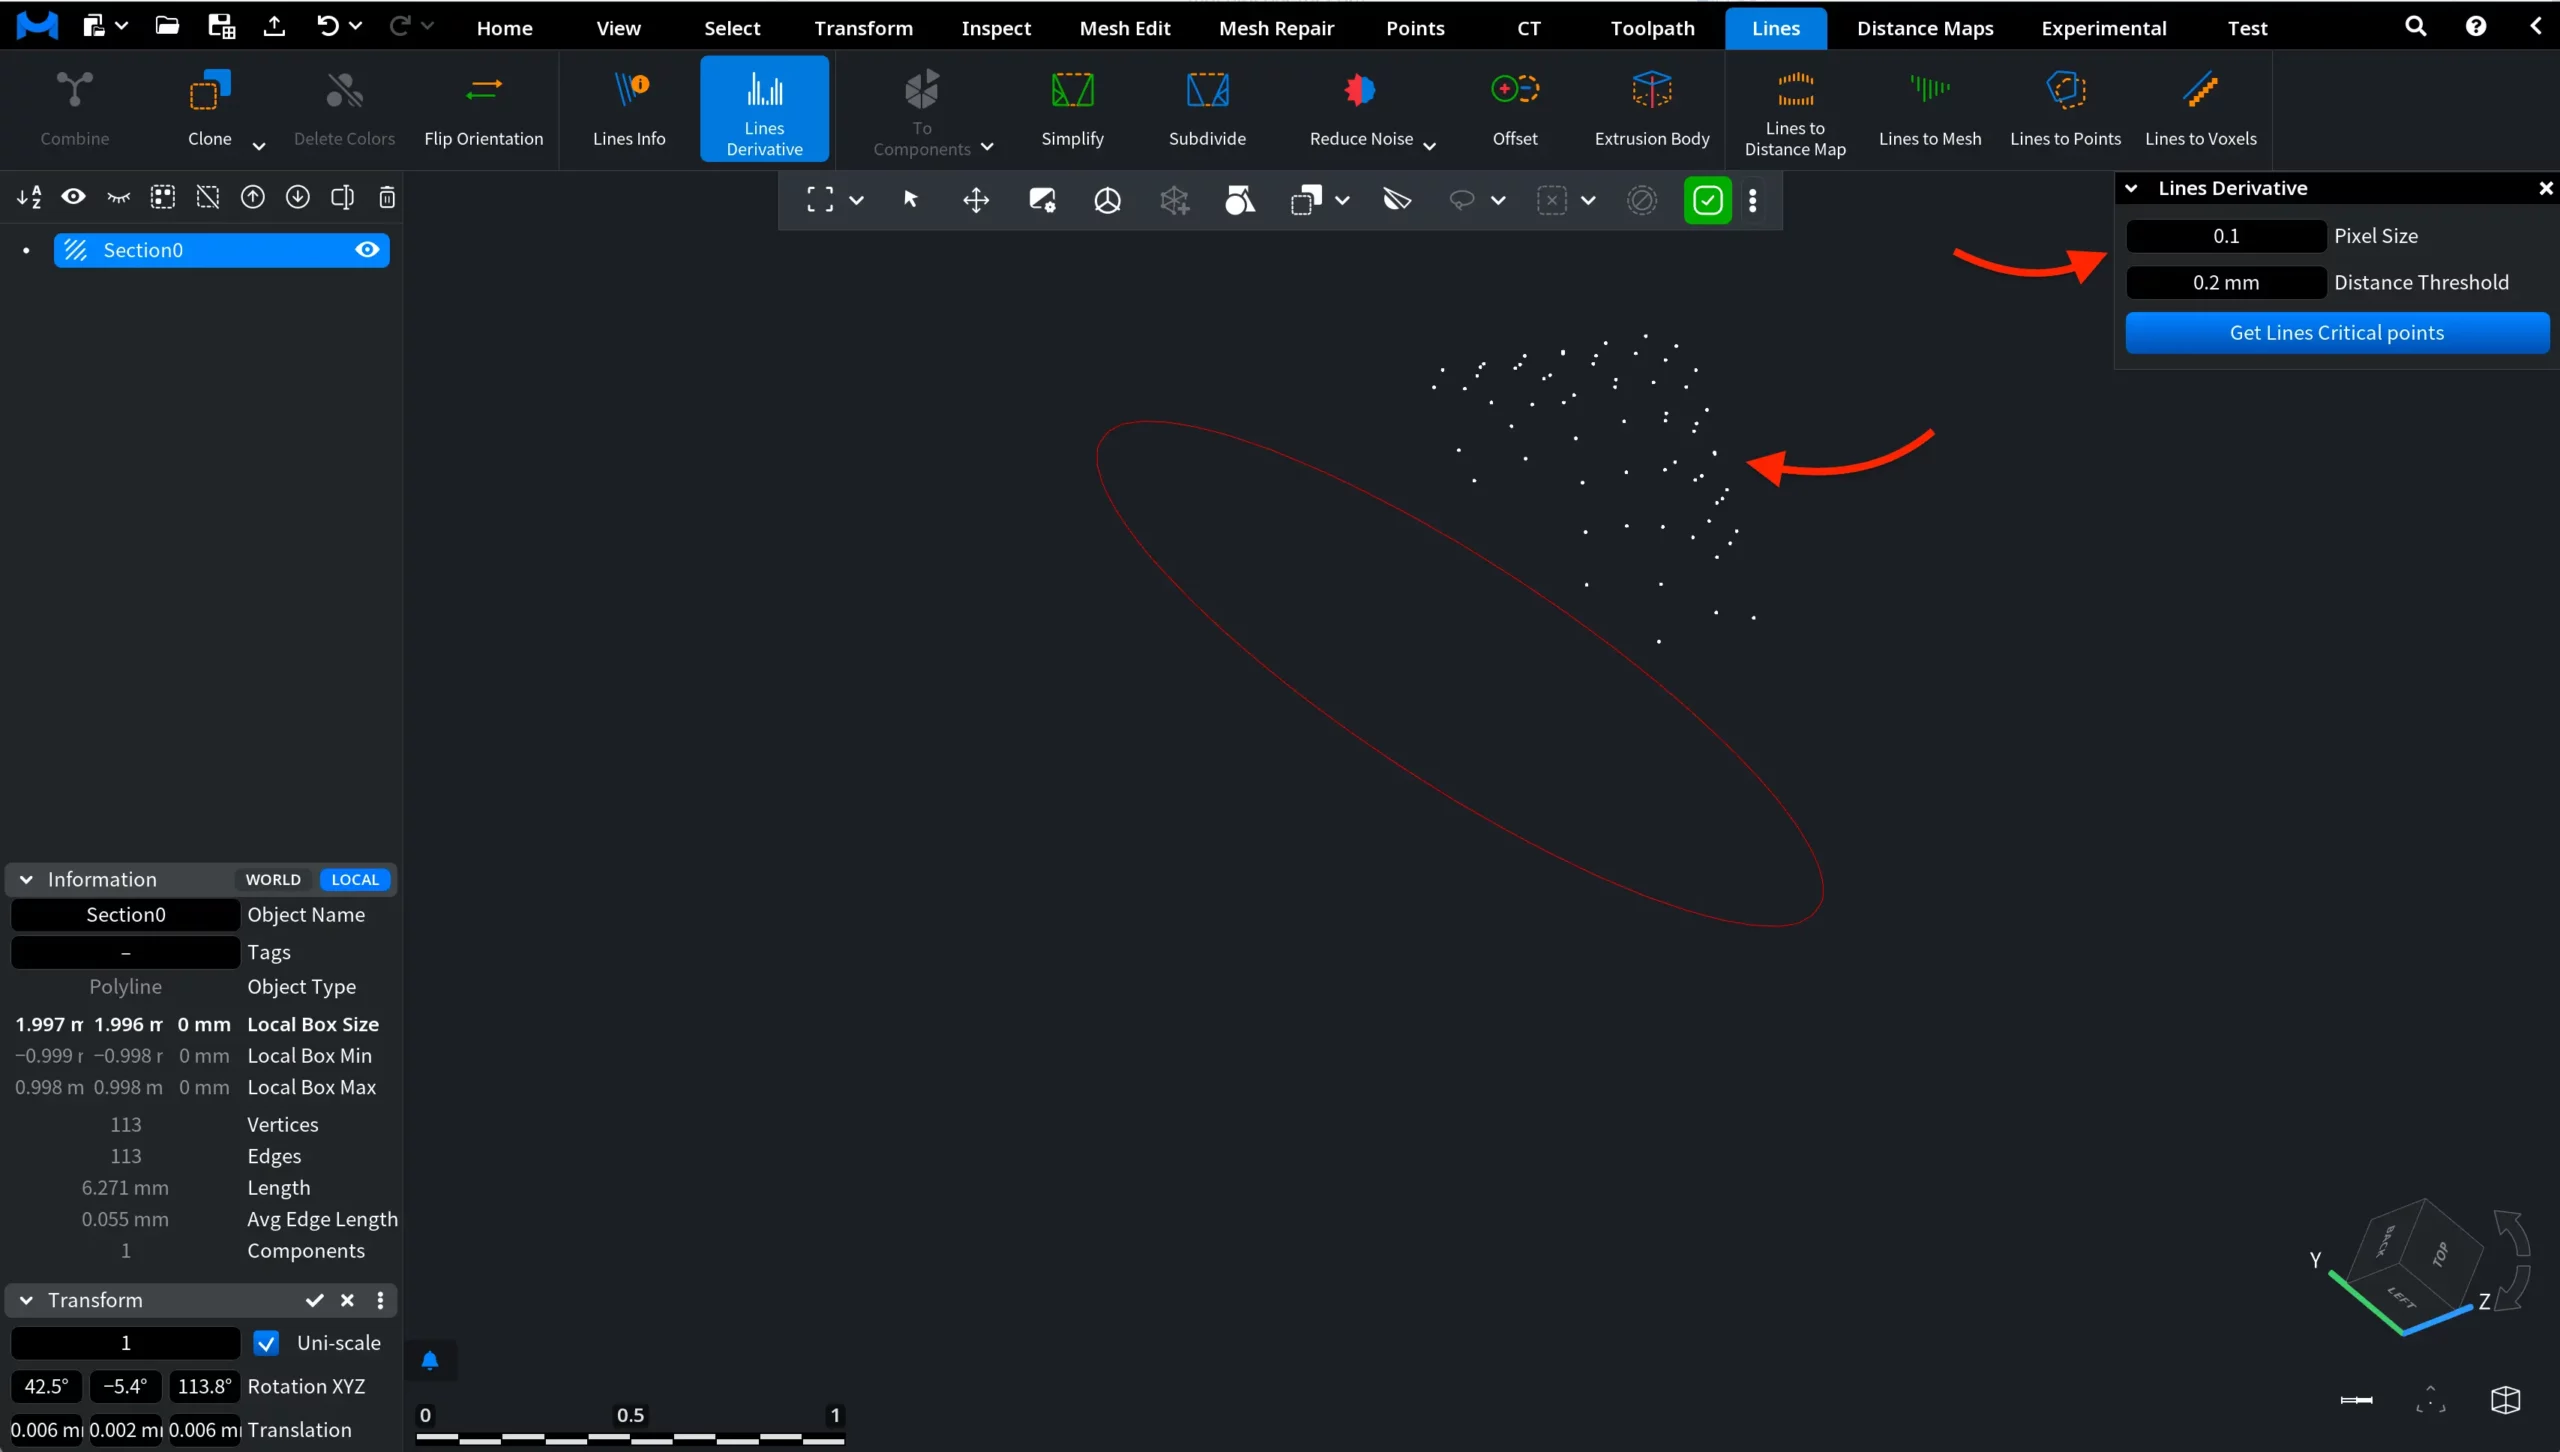
Lines Derivative: Example # 3. Higher Settings
In this example, the Pixel Size and Distance Threshold values are increased compared to the default configuration. After clicking Get Lines Critical points, the tool performs a less sensitive derivative analysis along the polyline. As an outcome, only a small number of critical points is detected and displayed in the viewport. The white markers appear sparsely, highlighting only the most significant geometric changes along the polyline.