
Voxels Line Graph plots the values of the voxels along a straight line through a voxel volume. Use it to see where the values jump — walls, material boundaries, pores — and to choose the iso value that puts the surface exactly at such a boundary. For the basics of voxel objects, see Voxels.
Open the tool
- Select exactly one voxel volume in the scene tree.
- Click CT › Voxels Line Graph. The button is unavailable while Volume Rendering is open.
The settings panel opens on the right, the Graph window shows the values, and a line appears in the viewport. At first the line runs along Z through the corner voxel of the volume, so the graph is often flat: move the line into the part.
Set the line
The line always crosses the whole volume parallel to one axis of the voxel grid; you cannot draw it between two arbitrary points.
- Choose the direction: Axis X, Axis Y or Axis Z (default).
- Set the position with the two other numbers (voxel indices from 0). For example, for Axis Z the line goes through the voxel with the given X and Y; the Z number does not move it.
- Or click the volume's surface in the viewport: the line jumps to pass through the clicked voxel.
Read the graph
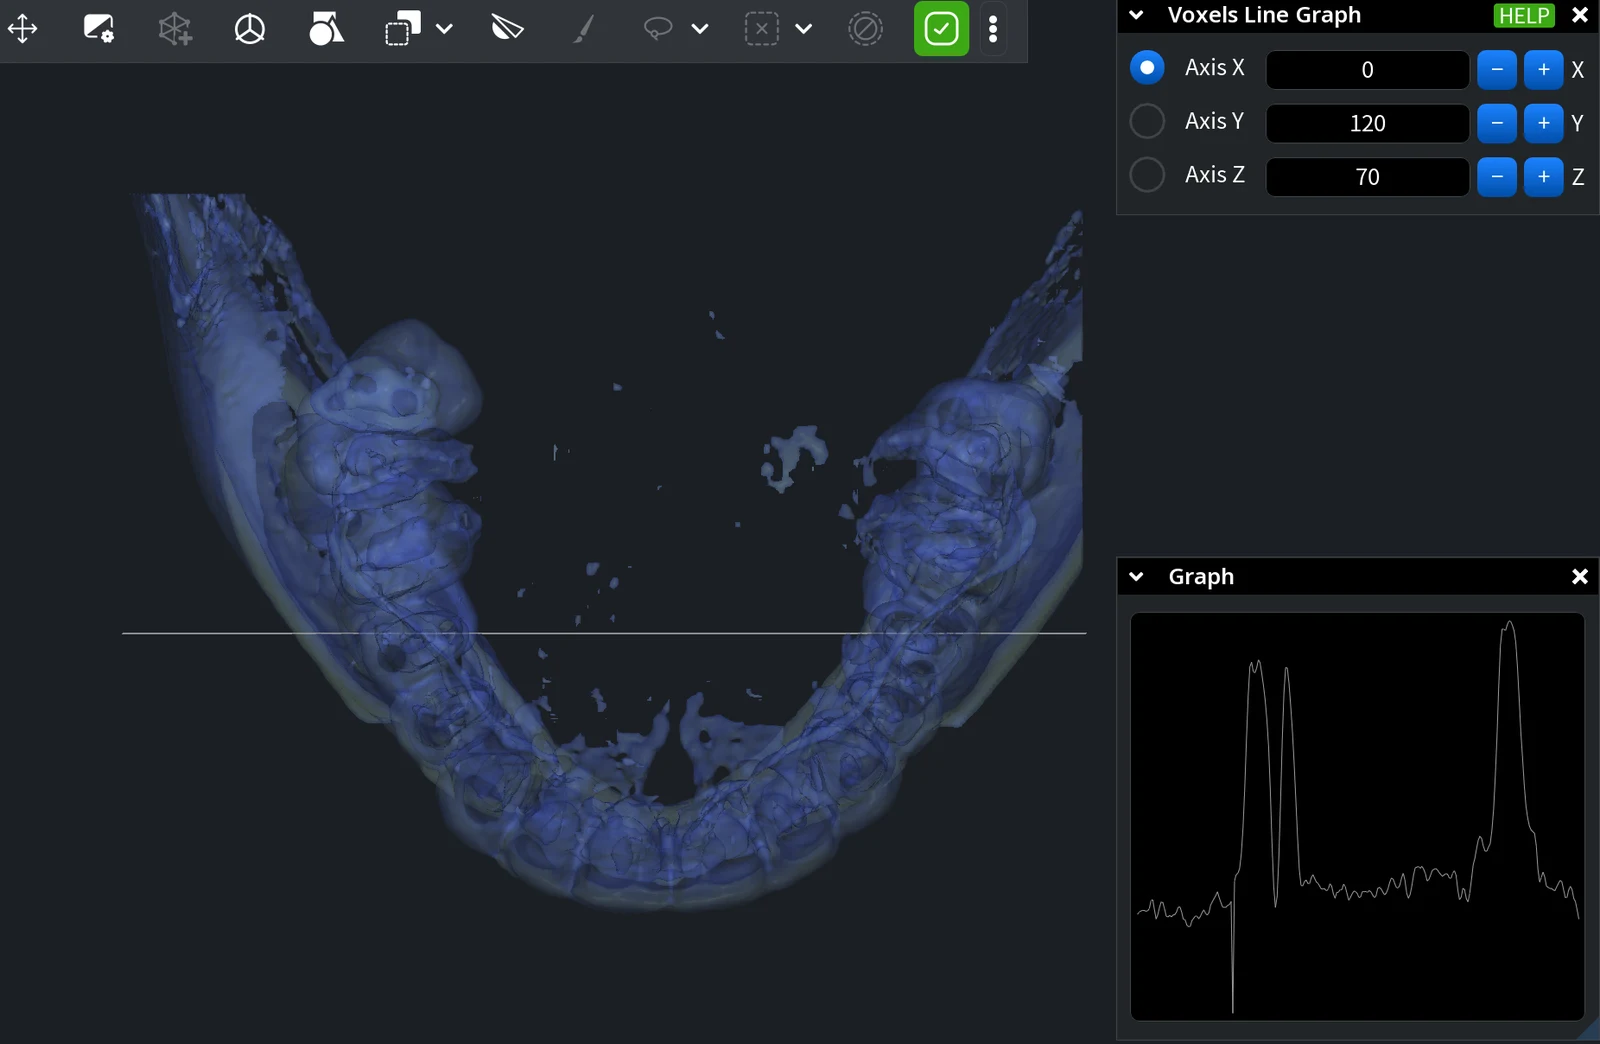
The horizontal axis of the graph is the position along the line, voxel by voxel, from one side of the volume to the other. The vertical axis is the voxel value, scaled to the lowest and highest values on this line.
- A flat part is one material (or air).
- A step between two levels is a boundary: the outer surface, a wall, the edge of a pore or an inclusion.
- In a CT scan, dense material has high values. In the example above, the line runs along X across the jaws: the peaks are where it crosses the teeth and bone on each side, and the low part between them lies inside the mouth.
- In a volume made from a mesh with Mesh to Voxels, the values are distances to the surface: negative inside, 0 on the surface, so the graph crosses zero at each wall.
Choose an iso value for Change ISO
The graph shows where and how sharply the values change, but it has no number scale. Use it to find the boundary, then read the values there:
- Put the line across the wall or boundary you want to reconstruct and check that the graph shows a clear step.
- Read the values on both sides of the step: hover the same place in the Slice window of Voxels Slice (it shows Density), or hover the section plane in the Clip Plane mode of Volume Rendering.
- Take a value about halfway between the two levels: the surface then runs near the middle of the boundary. Close Voxels Line Graph, open Change ISO and enter the value.


