The MeshInspector window has eight areas. This page shows each of them on a real part — a CAD enclosure — explains what it is for and points to the detailed guides. The screenshots are from MeshInspector 2.5.9 on macOS. Shortcuts are given for Windows and Linux; on macOS press Cmd instead of Ctrl, Option instead of Alt and Backspace instead of Delete.
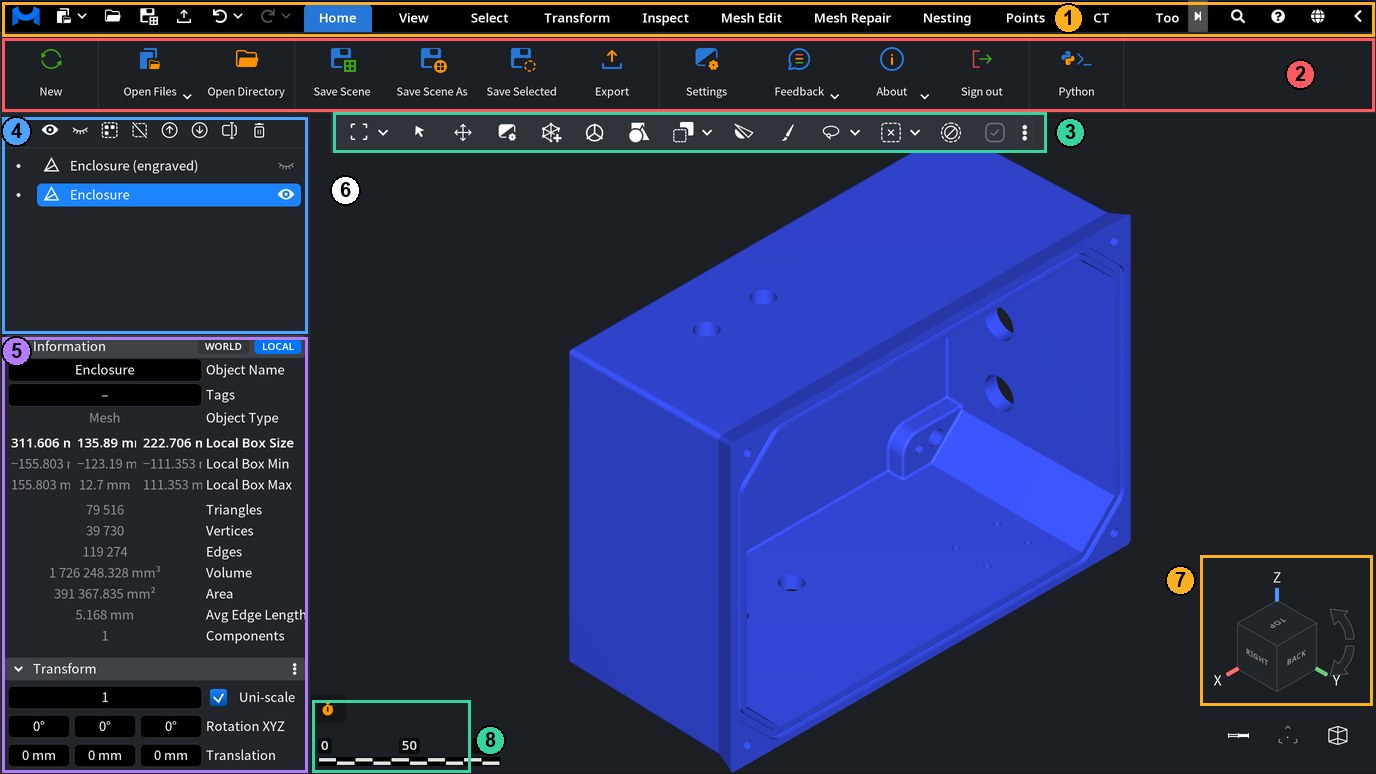
| # | Area | What it is for |
|---|---|---|
| 1 | Header | Quick-access buttons (open, save, export, undo, redo), the ribbon tabs, search and help. |
| 2 | Ribbon | The buttons of the selected tab: Home, View, Select, Transform and the others. |
| 3 | Viewport toolbar | The tools you use most often, one click away. You choose which ones it shows. |
| 4 | Scene tree | Every mesh, point cloud, line or volume in the scene: show, hide, select, rename, group. |
| 5 | Information and Transform | Numbers about the selected objects (size, triangles, volume, area) and their position. |
| 6 | Viewport | The live 3D view where you select, measure and edit. |
| 7 | View cube and axes | Which way the camera looks; one click turns it to a standard view. |
| 8 | Notifications and scale bar | Messages from the app and a ruler that shows the real size of what you see. |
Before you open a file: the start screen
When the scene is empty, the viewport shows the start screen.
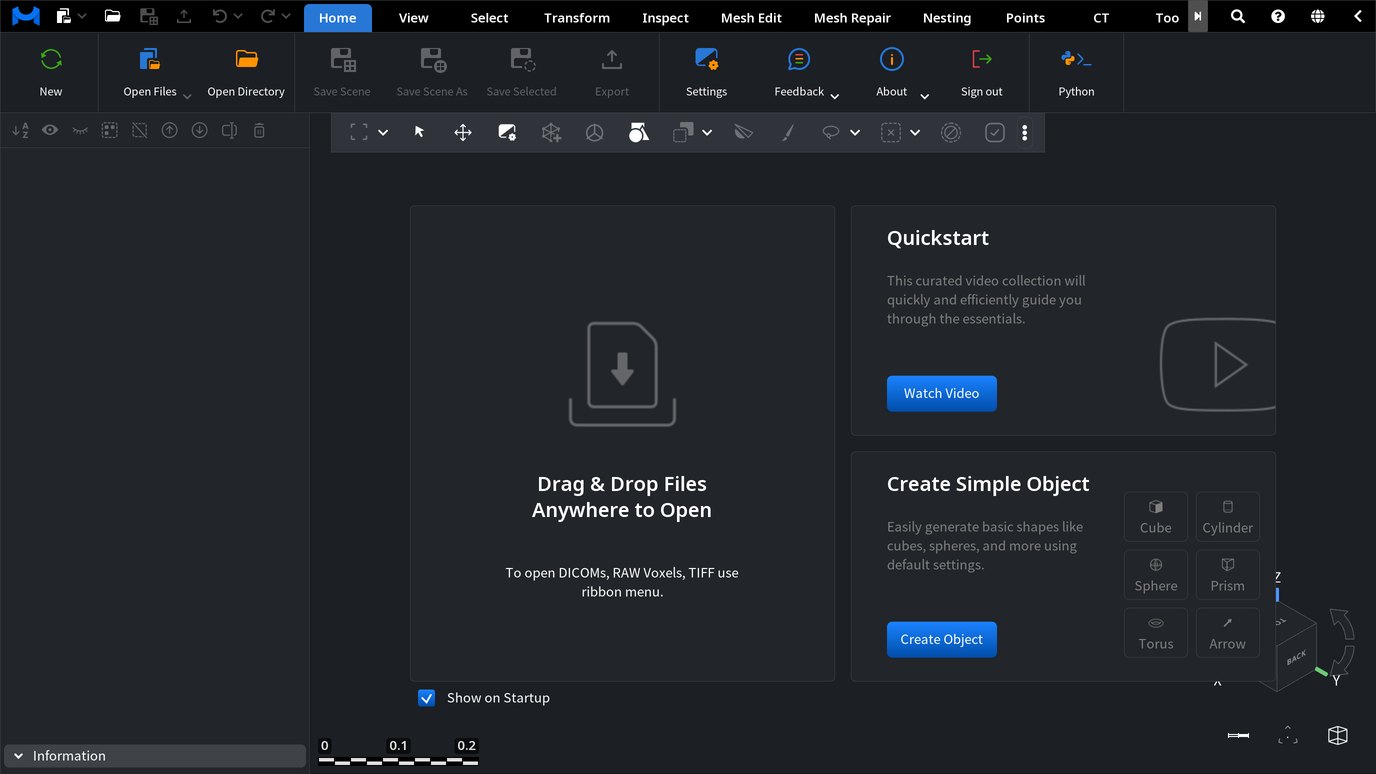
- Drag and drop a file anywhere into the window to open it. DICOM series, RAW voxels and TIFF stacks open from the ribbon instead (see Importing data).
- Watch Video opens the Quickstart video collection.
- Create Object adds a simple shape — a cube, cylinder, sphere, prism, torus or arrow — when you just want to try the tools.
- Clear Show on Startup if you do not want to see this screen again.
1. Header: quick access, tabs, search and help

Title bar
The title of the window shows the MeshInspector version and the email of the account you are signed in with. Mention the version when you report a problem; Home › About shows it too.
Quick-access buttons
The buttons left of the tabs stay visible whichever tab is open.
| Button | Shortcut | What it does |
|---|---|---|
| Open Files | Ctrl+O | Opens files through the system dialog. The arrow next to it lists recently opened files. |
| Open Directory | — | Loads every supported file from a folder and its subfolders. |
| Save Scene | Ctrl+S | Saves the whole scene back to the file it was opened from (.mru, the MeshInspector scene format). |
| Export | — | Saves the selected objects to separate files, for example STL or OBJ. |
Save Scene As (Ctrl+Shift+S) and Save Selected are on the Home tab. Saving and formats are covered in Saving and exporting a scene and Exporting objects.
Undo and redo
Undo (Ctrl+Z) steps back one action and Redo (Ctrl+Shift+Z) steps forward again. The arrows next to the two buttons list the recent actions, so you can go back several steps at once.
Ribbon tabs
Each tab holds the tools of one kind of work. In MeshInspector 2.5.9 they are Home, View, Select, Transform, Inspect, Mesh Edit, Mesh Repair, Nesting, Points, CT, Toolpath, Lines and Distance Maps. If the window is narrow, the last tabs scroll: use the arrow at the right end of the tab row.
Search, help, language and pin
| Button | What it does |
|---|---|
| Search (Ctrl+F) | Type part of a tool name or description and click a result to open the tool — the fastest way to find a tool when you do not know its tab. |
| Help (question mark) | Opens MeshInspector help in your browser. |
| Language (globe) | Switches the language of the interface. |
| Pin / Unpin | Pins the ribbon open or lets it collapse to the tab row, which gives the viewport more room. |
Every tool window also has its own help button in its header. It opens the article about that tool in this knowledge base.
2. Ribbon
The ribbon shows the buttons of the selected tab. A button that is greyed out tells you why in its tooltip — for example, Mesh Healer needs exactly one mesh to be selected. Select the right object in the scene tree, and the button becomes available. See Understanding Tool Interaction for the other reasons and for the tools that can stay open together.
3. Viewport toolbar

The toolbar floats above the viewport. Its buttons act on the objects that are selected in the scene. By default it shows these tools, from left to right:
| # | Tool | Shortcut | What it does |
|---|---|---|---|
| 1 | Fit Data | Ctrl+Alt+F | Frames all visible objects. The arrow offers Fit Selected Objects and Fit Selected Primitives. |
| 2 | Select Objects | Ctrl+Q | Selects whole objects by clicking them in the viewport. |
| 3 | Move Object | — | Moves an object in the scene with the mouse. |
| 4 | Settings | Ctrl+, | Opens the application settings. |
| 5 | Mesh Healer | — | Finds the problems of one mesh that can spoil a 3D print and repairs them: rebuilds the mesh to make it watertight or fixes local defects. |
| 6 | Transform Object | — | Changes the position of the selected objects in space with an on-screen gizmo. |
| 7 | Create Simple Objects | — | Adds a simple mesh: a cube or box, cylinder, sphere, torus or arrow. |
| 8 | Clone | — | Duplicates the selected objects. The arrow offers Clone Selection (copies the selected area into a new object and hides the original) and Multi Clone (several copies at once). |
| 9 | Section | — | Shows the cross-section of objects by a plane you place, so you can look inside; it can also create lines from that section. |
| 10 | Brush | — | Adds, removes or relaxes material on the surface of one mesh with a brush. |
| 11 | Select Primitives | Ctrl+W | Selects and deselects triangles of meshes and points of point clouds. The arrow offers Triangles Selector, Edge Selector, Select Incident Triangles, Select Short Edges and Select Twin Edges. |
| 12 | Clear Selections | Ctrl+X | Clears the selected triangles of meshes and points of point clouds. The arrow offers Clear Selected Edges. |
| 13 | Delete Selected | Delete | Deletes the selected area: triangles of a mesh or points of a point cloud. |
| 14 | Active List (check mark) | — | Lists the tools that are open now, so you can close one from here. |
Customize the toolbar
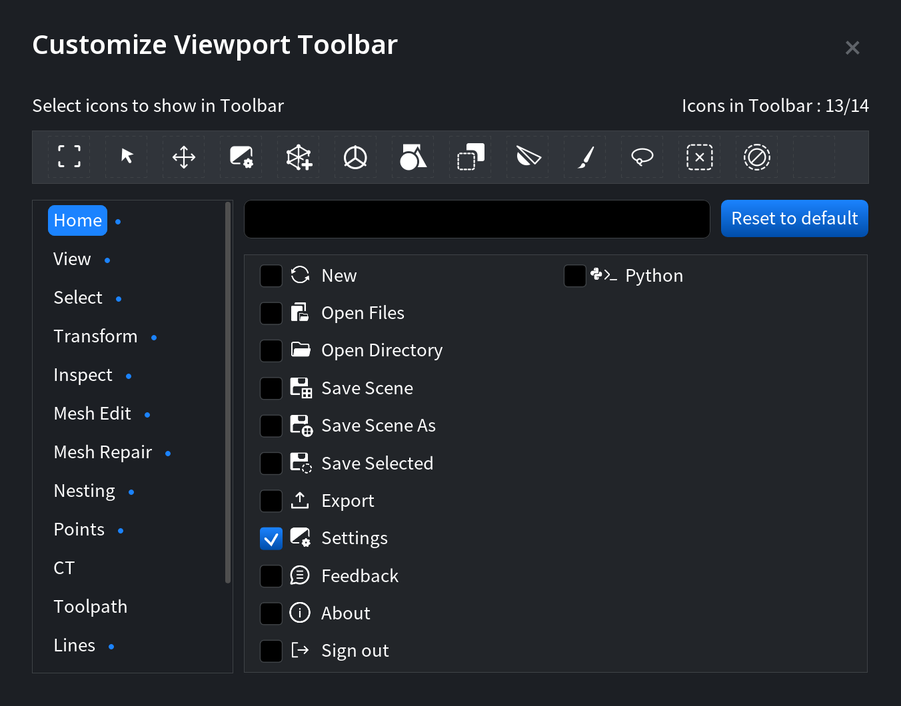
- Click the ⋮ button at the right end of the toolbar.
- Pick a tab on the left — the tools are grouped by tab — and tick the tools you want to see. The counter shows how many icons the toolbar holds; it fits up to 14.
- Drag the icons in the top row to change their order.
- Reset to default brings back the standard set.
If your screen is small, keep only the tools you use daily. Everything else stays one click away on its tab or in Search.
4. Scene tree
The scene tree lists every object in the scene: meshes, point clouds, lines, distance maps and volumes. Click an object to select it, use the eye icon to show or hide it, and right-click it for its display options. The buttons above the list sort, show, hide, select, rename and remove objects. All of it is explained in Scene tree: visibility, appearance and per-object settings.
5. Information and Transform panels
Below the scene tree, Information shows the numbers of the selected objects: name, tags, type, bounding box size, triangles, vertices, edges, volume, area, average edge length and the number of components. World and Local switch between the scene coordinates and the object's own ones. Transform shows the rotation and translation of the selected object and lets you type exact values; Uni-scale keeps the proportions when you scale.
6. Viewport
The viewport is the stage for inspection, measurement and editing. Rotate, pan and zoom with the mouse — see Camera navigation controls — and use the View tools for exact front, top or isometric views. To compare several views at once, split it into two or four viewports.
7–8. View cube, axes, notifications and scale bar
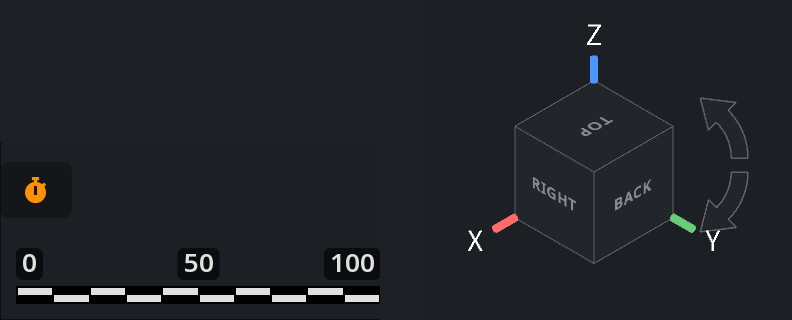
| Element | Where | What it does |
|---|---|---|
| View cube | Lower right | Click a face, an edge or a corner of the cube to look at the model from that direction. The two curved arrows turn the view by 90° around the line of sight. The colored lines show the X, Y and Z axes. |
| Scale bar | Lower left | A ruler that resizes itself as you zoom and shows the real size of what you see. |
| Notifications (bell) | Above the scale bar | Opens the history of recent messages: results of operations, warnings and reminders. |
Press Num 5 to switch between orthographic projection (no perspective distortion, good for measuring) and perspective projection (real-world depth). The same choice is in View › Camera Navigation.
Keyboard shortcuts worth learning first
Press F1 at any time to see every shortcut of your version.
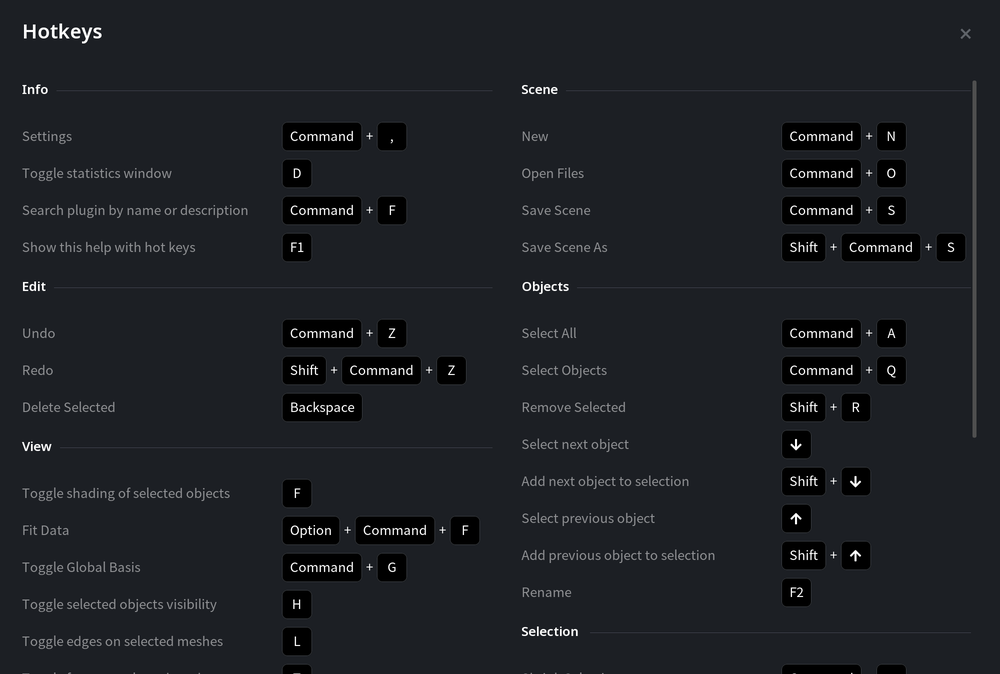
| Action | Shortcut |
|---|---|
| Open files / save scene / save scene as | Ctrl+O / Ctrl+S / Ctrl+Shift+S |
| Undo / redo | Ctrl+Z / Ctrl+Shift+Z |
| Search a tool | Ctrl+F |
| Fit all visible objects | Ctrl+Alt+F |
| Show or hide the selected objects | H |
| Select the next or previous object | Down / Up arrow (with Shift to add to the selection) |
| Rename the selected object | F2 |
| Front / right / top view | Num 1 / Num 3 / Num 7 (with Ctrl for back / left / bottom) |
| Turn the view around | Num 9 |
| Show edges / faces / flat shading of selected meshes | L / T / F |
| Settings | Ctrl+, |


